
Figure 6.
Temporal Decomposition of Neutral and Deleterious Variation among Present-Day Individuals in a More Realistic Demographic Model
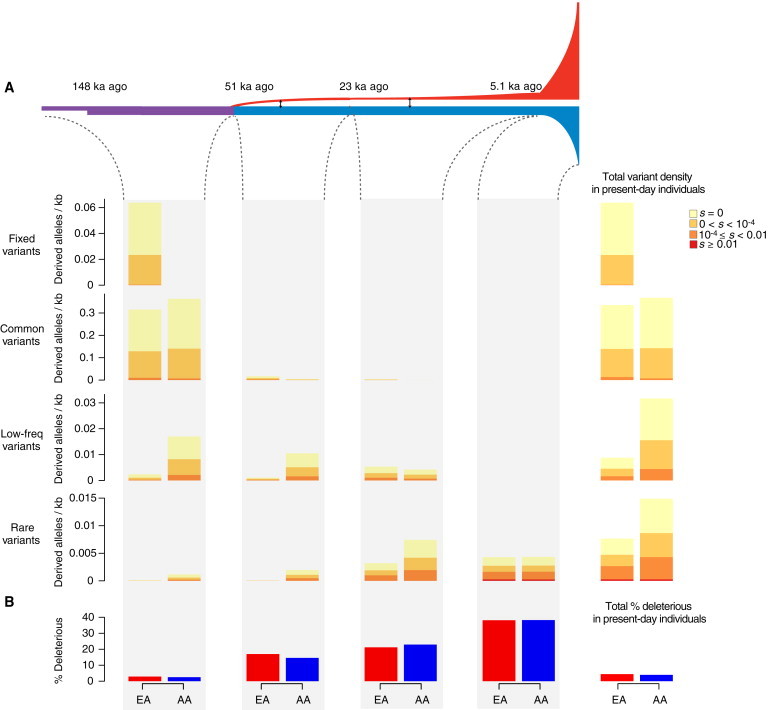
(A) Diagram of a more realistic demographic model for EA and AA populations. This model involves multiple bottlenecks in the EA lineage, recent accelerated growth, and admixture as inferred by Tennessen et al.12 As in Figure 4, the far right column shows the mean number of derived alleles per individual per kilobase in present-day individuals as a function of DAF (fixed DAF = 1, common DAF ≥ 0.05, low-frequency 0.01 ≤ DAF < 0.05, and rare DAF < 0.01) and selection coefficients. Similarly, we decomposed variant density in present-day individuals according to when the mutation arose (before the Out-of-Africa bottleneck, during the bottleneck, during the initial period of growth in EA individuals, or during the recent accelerated growth in both EA and AA individuals).
(B) The proportion of deleterious alleles (|s| ≥ 10−4) per individual in present-day individuals and as a function of when the mutation arose.