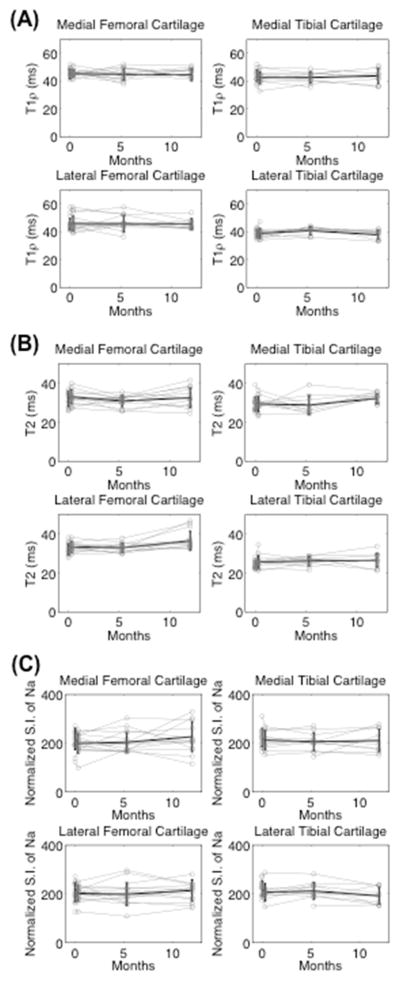
Figure 4.
The measurements of all regions of the healthy subject’s cartilage are shown in gray. The mean and standard deviation of the eight subjects are shown in black. The 10 ROIs are grouped into the medial and lateral femoral and tibial compartments for simplicity. These graphs show the consistency of the measurements over time for (A) T1ρ (B) T2 and (C) sodium measurements.

