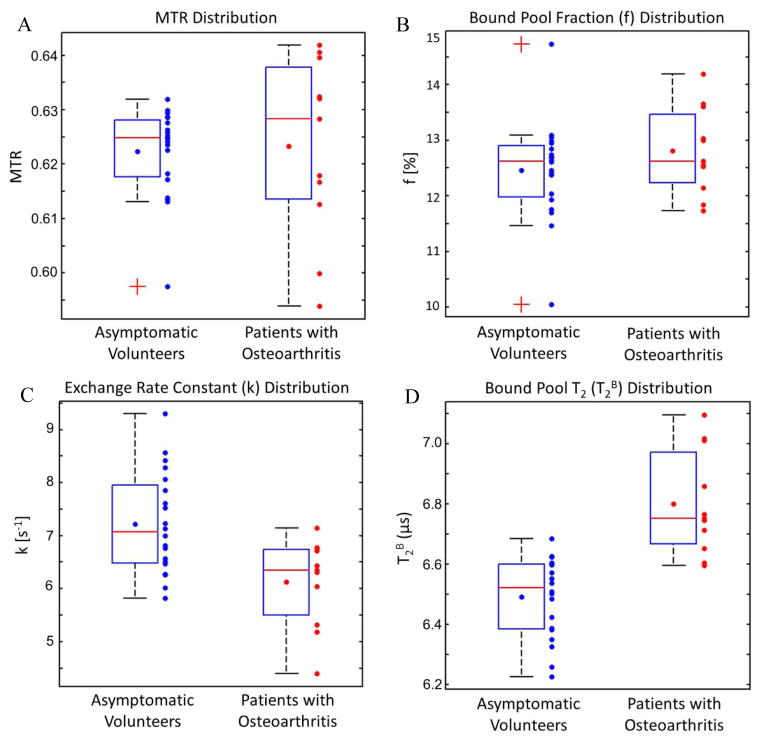
Figure 1.
Box plots illustrating the distribution of (A) MTR, (B) f, (C) k, and (D) T2B values of patellar cartilage in asymptomatic volunteers and patients with osteoarthritis. The boxes indicate interquartile ranges, the blue dots within the boxes indicate average values, the red lines within the boxes indicate median values, the whiskers extend to the most extreme data points not considered outliers (1.5 of the interquartile range between the first and third quartiles), and the crosses indicate outliers.

