
FIGURE 1.
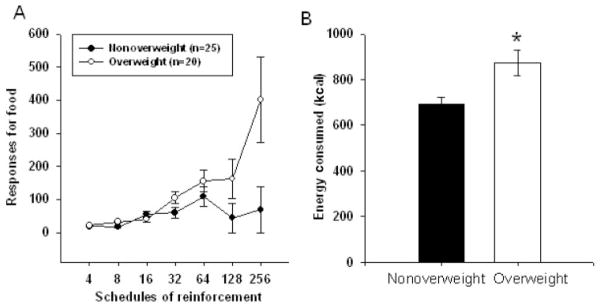
Results from experiment 1. A: Mean ( ± SEM) number of responses at each schedule of reinforcement in nonoverweight (<75th BMI percentile; n = 25) and overweight (≥90th BMI percentile; n = 20) children. Reinforcing value was analyzed with a mixed-effects regression model to compare the pattern of operant responding as a function of schedules of reinforcement for food with zBMI, sex, age, preexperimental hunger, and dietary restraint as time-invariant predictors and schedule of reinforcement (VR4 – VR256) as the time-variant predictor. There was a significant interaction of zBMI and reinforcement schedule (P <0.001), with children with higher zBMI values responding significantly more for food as the reinforcement schedules progressed. B: Mean ( ± SEM) energy consumed in the laboratory in nonoverweight and overweight children. Differences in laboratory energy intake were determined by using ANCOVA with weight status and sex as the between-subjects factors and dietary restraint score as the covariate. Overweight children made significantly more responses for food over trials (P = 0.044). *Significantly different from nonoverweight children, P = 0.003.