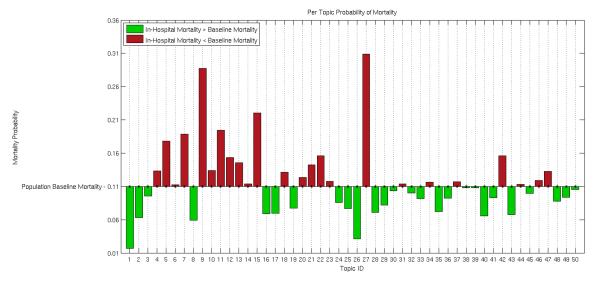
Figure 2.
The probability of in-hospital mortality for each topic, indicating that topics represent differences in outcome. Probabilities are calculated as (see section 3.3). Each bar shows the prevalence of a given topic k in the mortality category, as compared to the set of all patients. Bars are shown as above (in red) or below (in green) the baseline in-hospital mortality based on the value of θk for each topic k.

