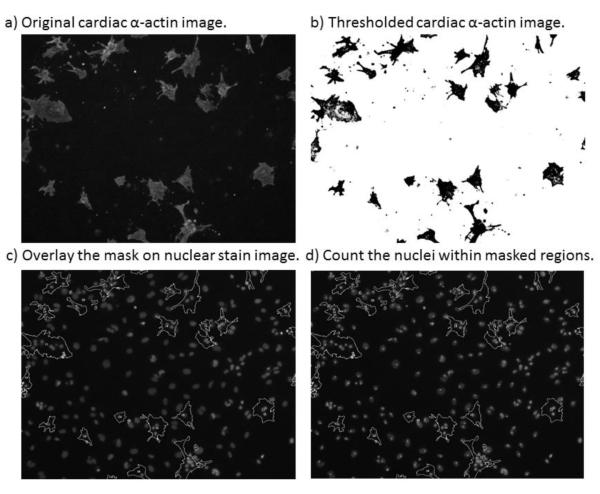
Figure 1.
Demonstration of the steps of microscopic cytometry. A fluorescent image of one of the cultures labeled with antibodies against cardiac α-actin (a). This image is then thresholded to create a binary mask (b), which is overlaid on the Hoechst nuclear stain image of the same region of the culture (c) and the nuclei within the masked regions are counted to determine the CM number (d).

