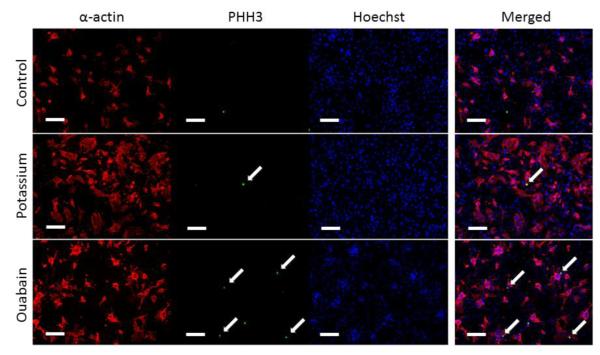
Figure 3.
Representative images of sarcomeric α-actin (red), PHH3 (Green), Hoechst (Blue) for control P3 cardiac cell cultures and P3 cultures subjected to 40 mM potassium gluconate or 10 μM ouabain. Merged images for each of the three groups are shown on the right. The white arrows denoted proliferating cells indicated by the PHH# positive nuclei. Scales bar equal 100 μm in all images.

