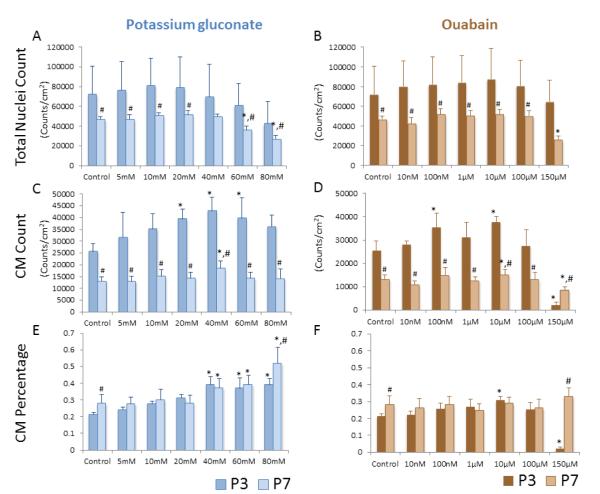
Figure 4.
Total nuclear density for potassium gluconate and ouabain. CM density as measured by sarcomeric α-actin positive cells for potassium gluconate (c) and ouabain (d). CM percentage for potassium gluconate (e) or ouabain (f). Data from P3 cells is shown in the darker color bars, while data from P7 cells is displayed in the lighter color bars. (*p<0.05 among treatment compare to control, ANOVA; #p<0.05 comparison between P3 and P7 cells at the same treatment).

