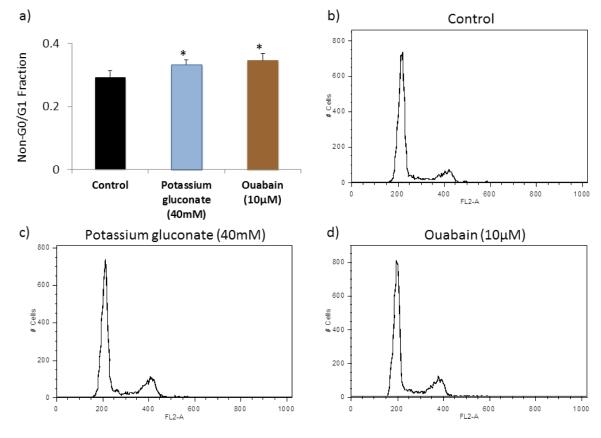
Figure 7.
Cell cycle analysis in P3 populations carried out by flow cytometry on cells labeled with propidium iodide. (a) Non-G1/G0 cells percentage in each group. (*p<0.05 compared to control group, n=4, 10000 counts per sample, ANOVA). FL-2A channel histogram for (b) control group, (c) 40mM potassium gluconate, (d) 10μM ouabain.

