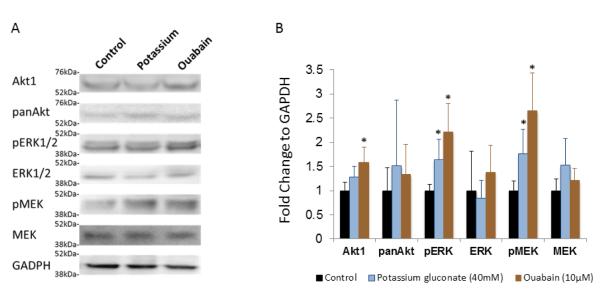
Figure 8.
a) Representative Western blots of Akt1, pan Akt, pERK1/2, ERK1/2, pMEK, MEK, and GAPDH of control cultures of P3 cardiac cells as well as those subjected to the two depolarization treatments at the optimal concentrations. b) Quantification of Western blot derived expression, normalized to control conditions. * denotes p<0.05 compared to control condition.

