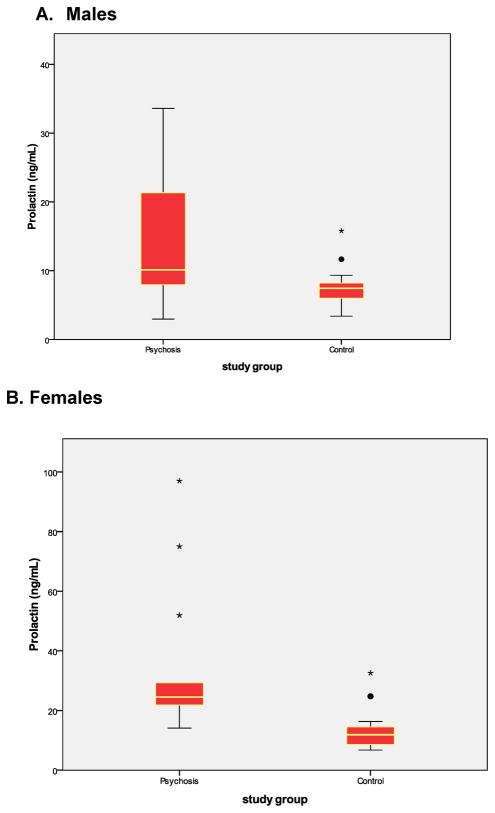
Figure. Distribution of Prolactin Concentrations in Males and Females.
The colored boxes include the middle 50% of each group. The horizontal line within the colored box represents the median. The data between the colored box and the tails contain the upper and lower quartiles, excluding outliers, which are represented by stars and filled circles.

