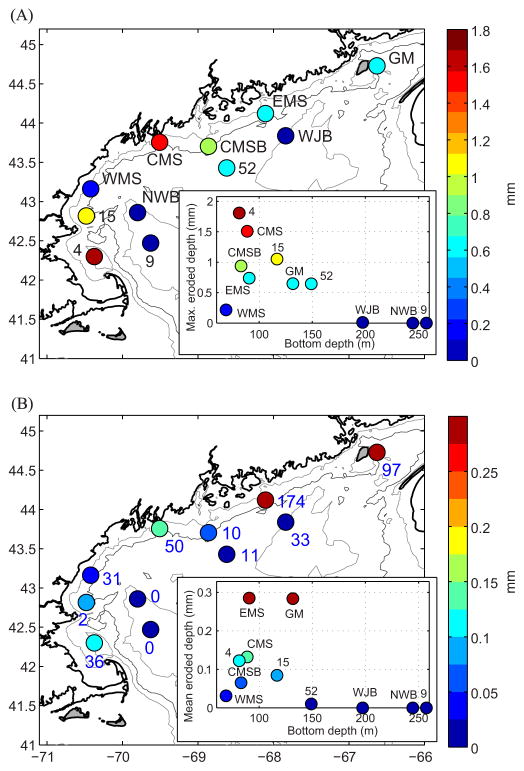
Fig. 9.
(A) Maximum depth of sediment eroded and (B) mean eroded depth during resuspension simulation for the period October 1, 2010–May 31, 2011. Both (A) and (B) show parameters in map view and as a function of bottom depth (inset graph lower right). See Fig. 1 for station key. The number adjacent to the stations in (B) is the number of times the threshold of 0.1 Pa is exceeded. Although stress exceeds the threshold each tidal cycle at GM (northernmost station), the number of events is limited by the 6 h persistency requirement for an event. Isobaths are 50, 100 (dark) and 200 m. The mean eroded depth over the winter-spring period is a measure of the average amount of bed material in suspension.

