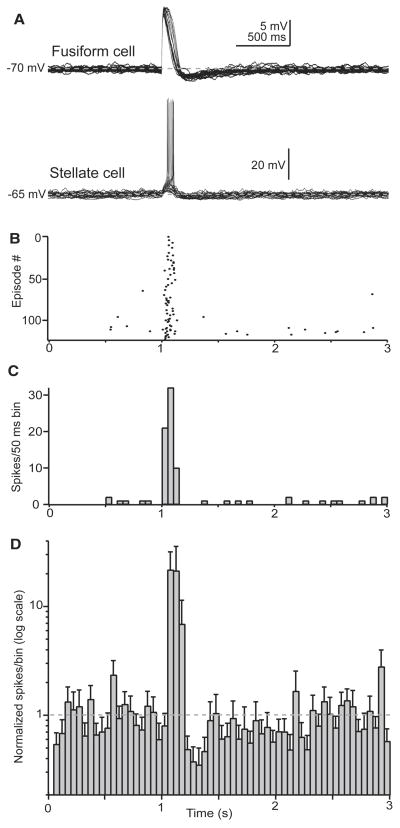
Figure 4.
Subthreshold events in fusiform cells drive spikes in stellate cells.
A) Example recording (20 single trials) from a coupled fusiform-stellate cell pair (upper and lower panels, respectively). A subthreshold aEPSP is produced by injecting an EPSC-like waveform into the fusiform cell at ΔT=1 s (peak amplitude: 350 pA). Of note is the clustering of spikes in the stellate cell recording specifically during the fusiform cell aEPSP.
B) Raster plot showing 123 trials from the pair in A. Subthreshold events in the fusiform cell cause time-locked spikes in the stellate cell.
C) Histogram (50 ms bins) from the same pair as panels A and B.
D) Summary histogram (50 ms bins) from 7 pairs as in A–C. The data are normalized to the number of spikes/bin during the 1 s prior to EPSC injection in the fusiform cell. Subthreshold events in fusiform cells caused a 21±12 fold increase in the number of stellate cell spikes/bin at ΔT=1.05–1.1 s, followed by a non-significant reduction in spike count at ΔT=1.2–1.4 s (baseline: 7.4±3.9 spikes/bin; ΔT=1.05–1.1 s: 34.9±9.0 spikes/bin; ΔT=1.2–1.4 s: 6.1±4.4 spikes/bin, p=0.01 and 0.2 compared to baseline, respectively. Repeated measures ANOVA + Dunnett's test). Of note is that the y-axis is plotted on a logarithmic scale.

