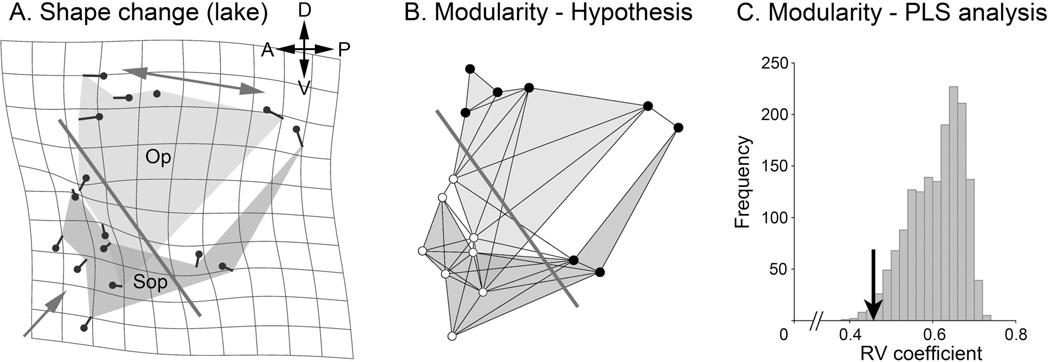
Fig. 5.
Evolutionary change (A) predicts developmental modularity (B, C) in stickleback. A. Average Procrustes shape change of the opercle (Op) subopercle (Sop) two-bone configuration in two Alaskan lacustrine populations (Boot and Bear Paw Lakes) as compared with an oceanic population (ancestral, Rabbit Slough). The small lollypop-like symbols represent landmarks along the bone edges. The directions and lengths of the tails of these symbols indicate the local bone shape changes in the lake populations. As explained in the text, the large single-headed and double-headed arrows show different shape changes in the dorsal and ventral regions of the configuration. The bold, diagonally oriented line separates these two regions. B. This bold line is hypothesized to be a module boundary between dorsal (upper, 8 dark landmarks) and ventral (lower, 8 white landmarks) modules. The finer lines show proposed landmark connectivities within the configuration, following Klingenberg, 2009. C. Partial least squares (PLS, Klingenberg, 2009) analysis reveals that the RV (multivariate correlation) coefficient of the proposed module pair (arrow, RV=0.46) is among the lowest of all possible subdivisions (n= 1587) that separate the configuration into two blocks of 8 contiguous landmarks each. Only 15 subdivisions yielded a lower RV coefficient (Proportion lower=0.009). Original analysis, dataset from Jamniczky et al., 2014).

