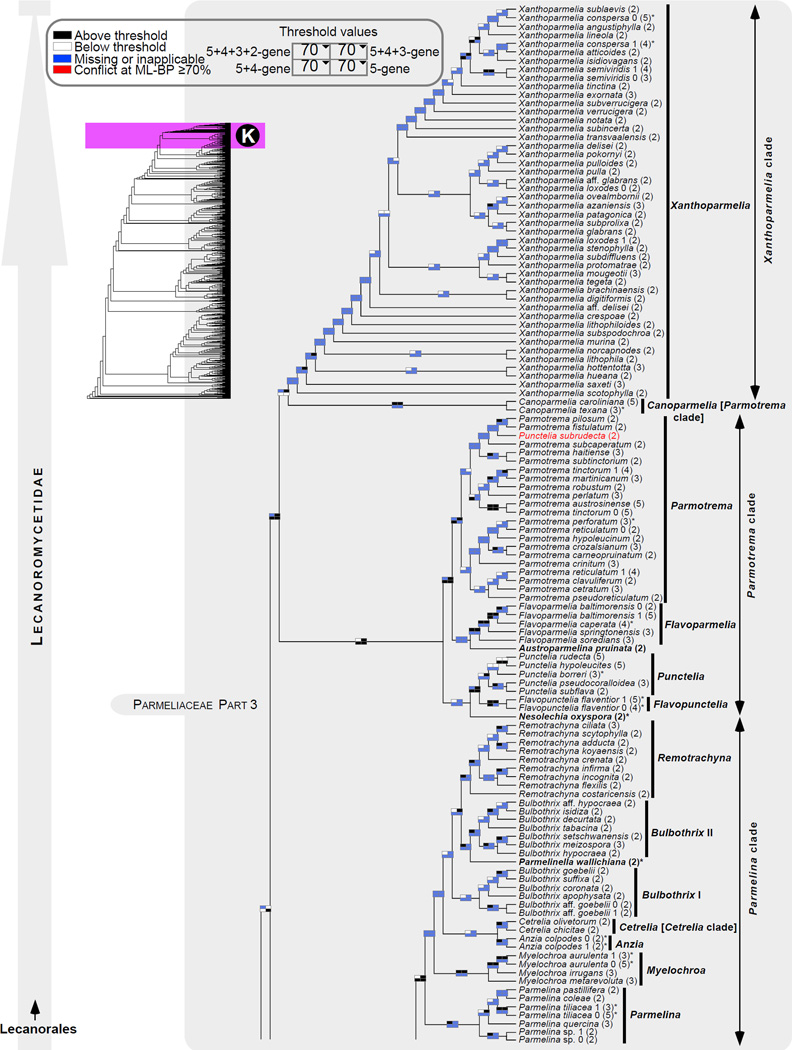
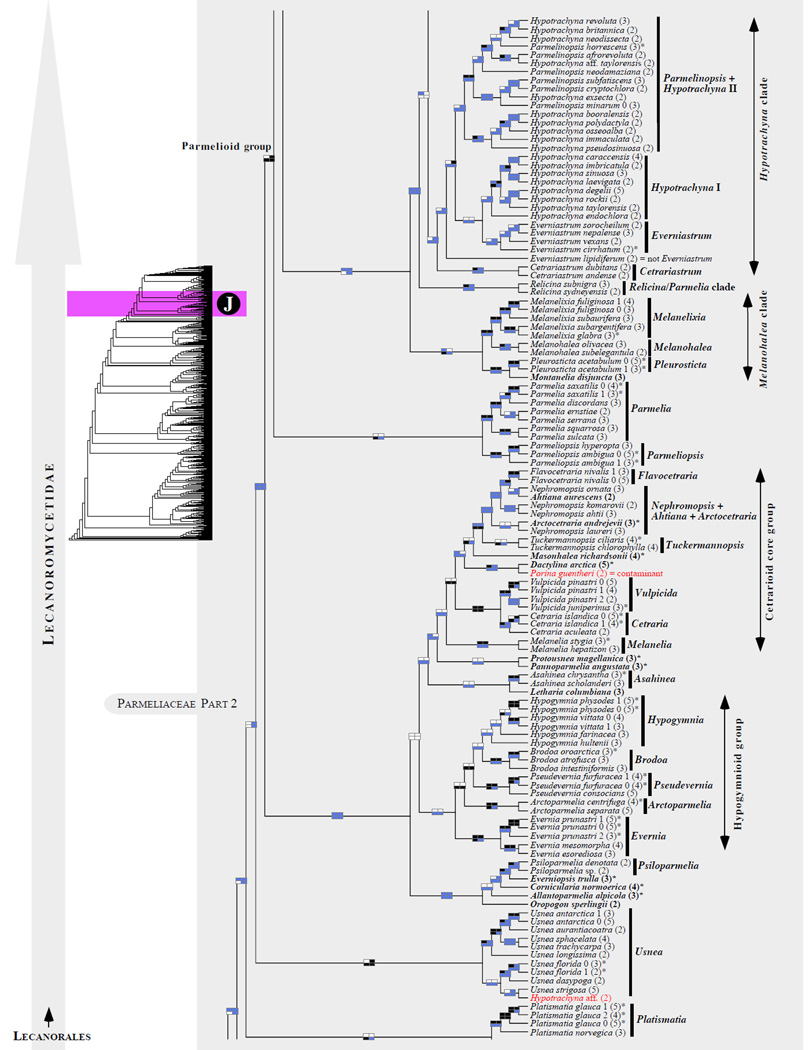
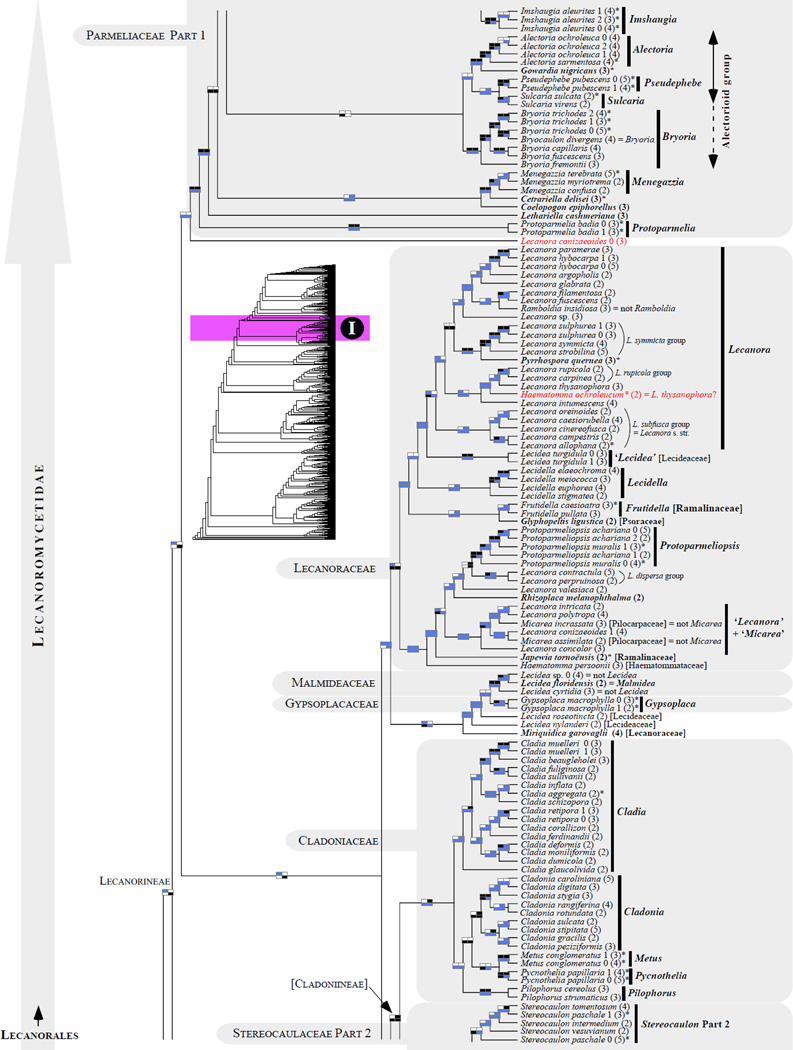
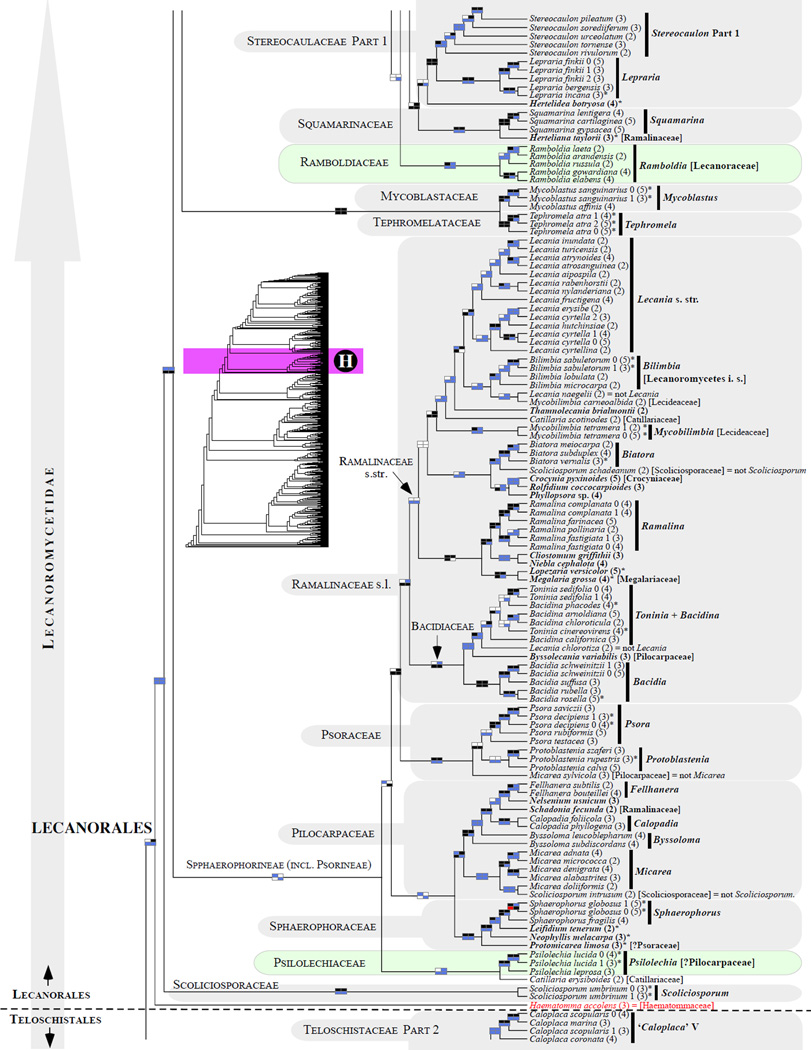
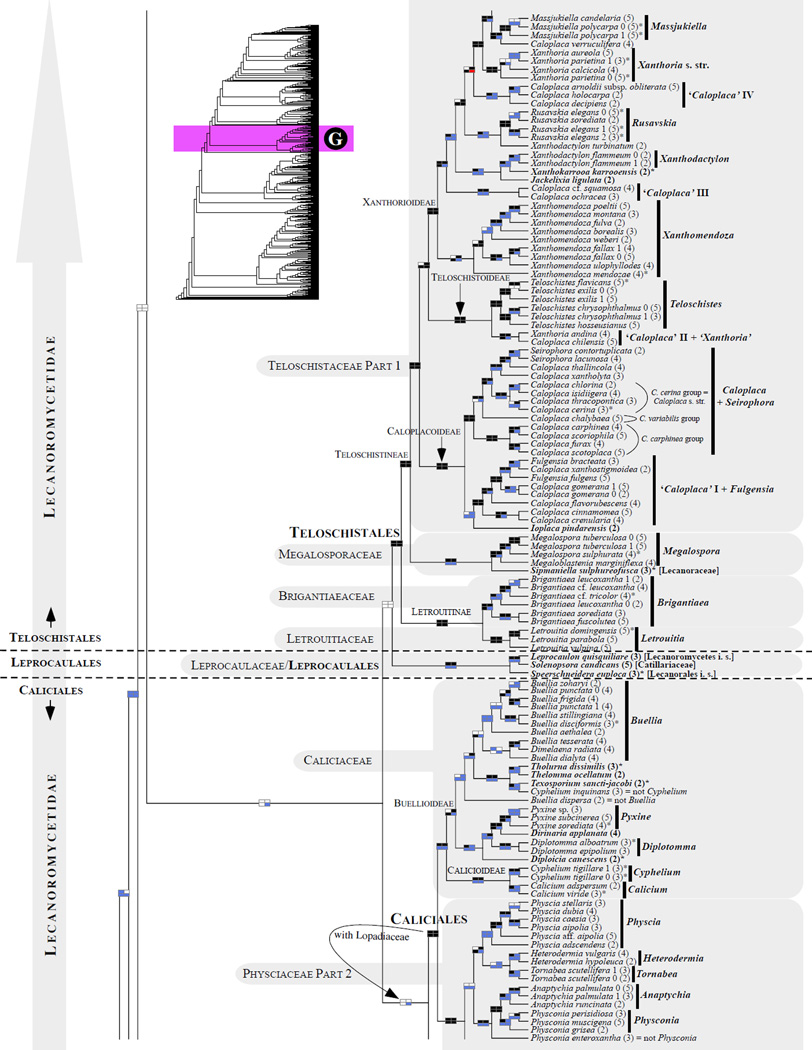
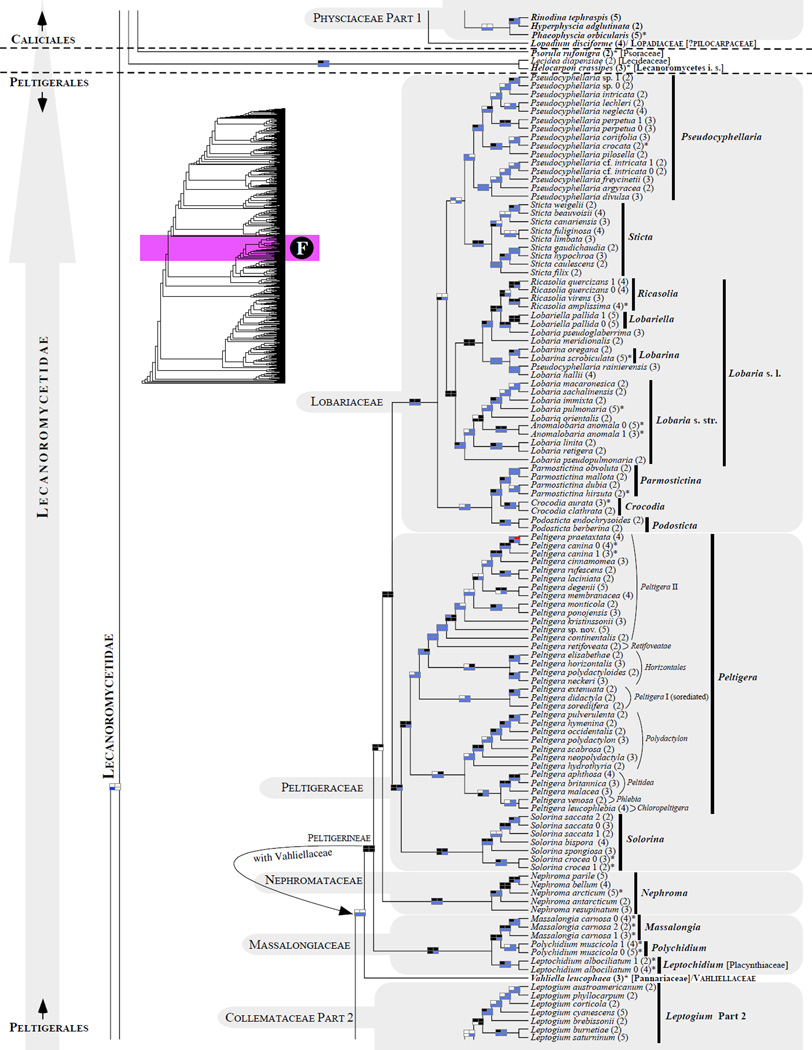
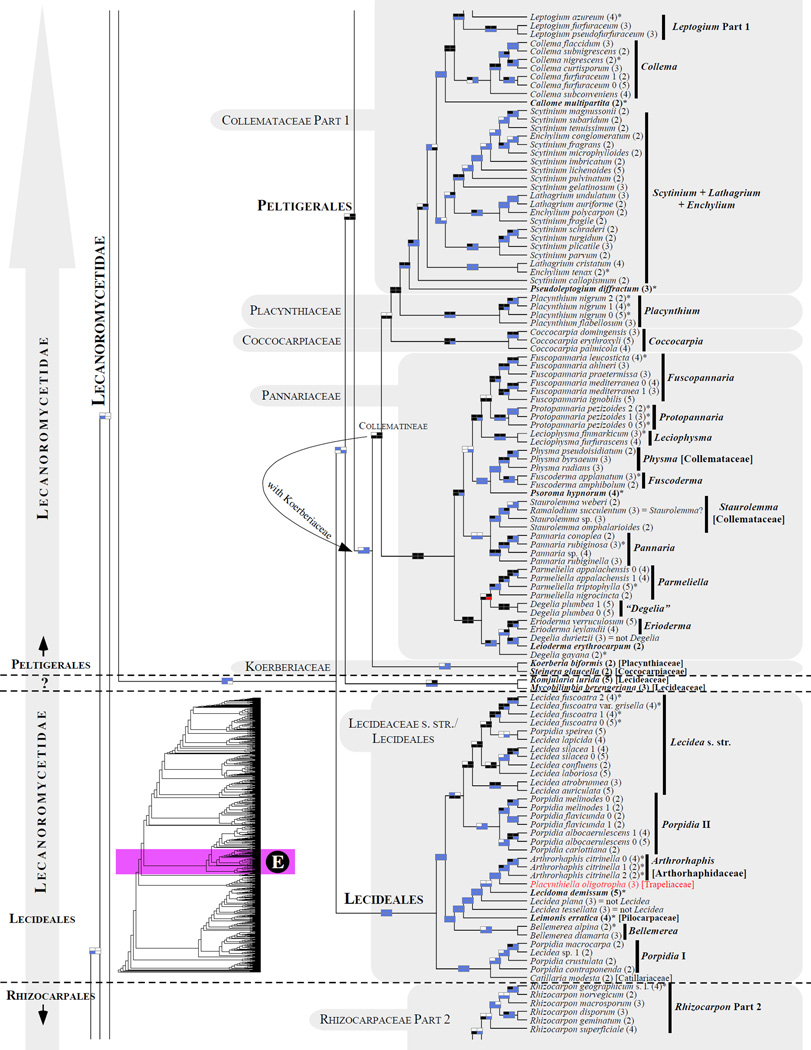
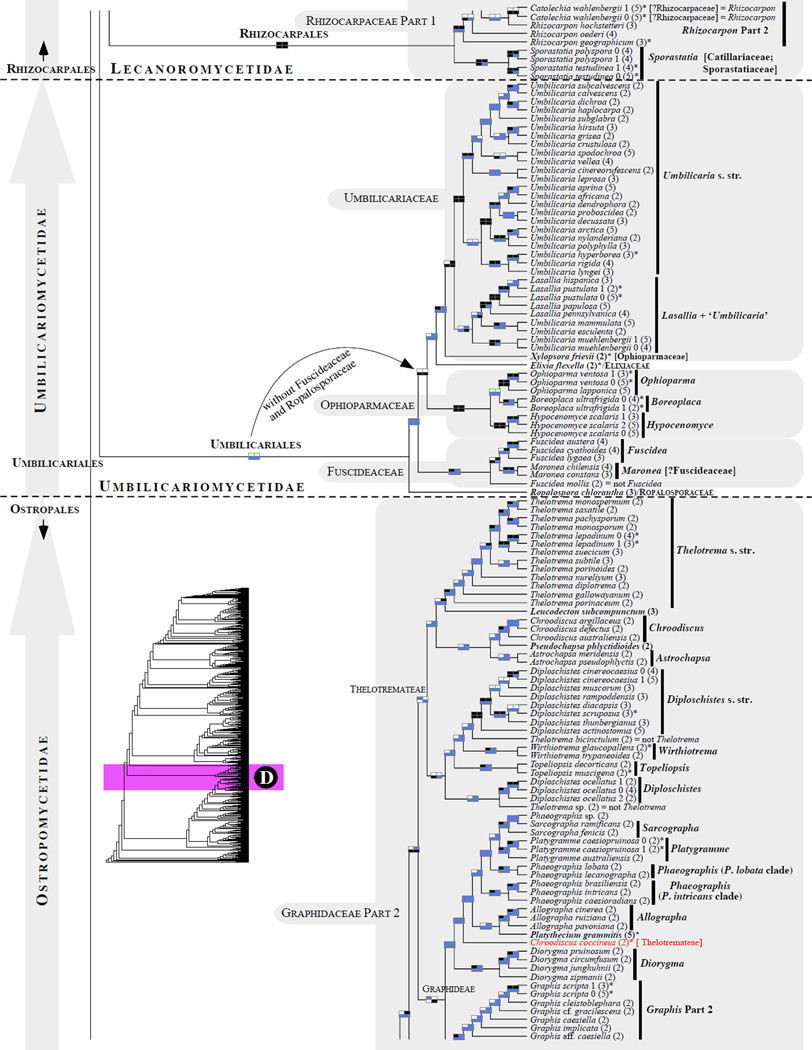
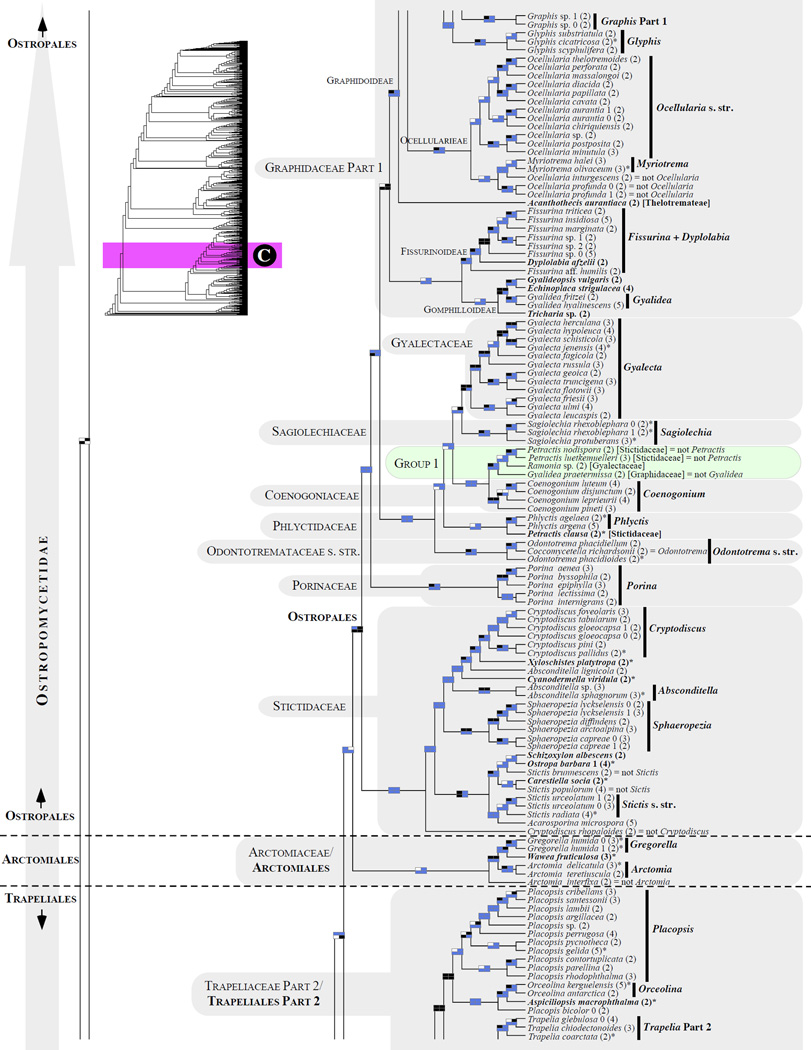
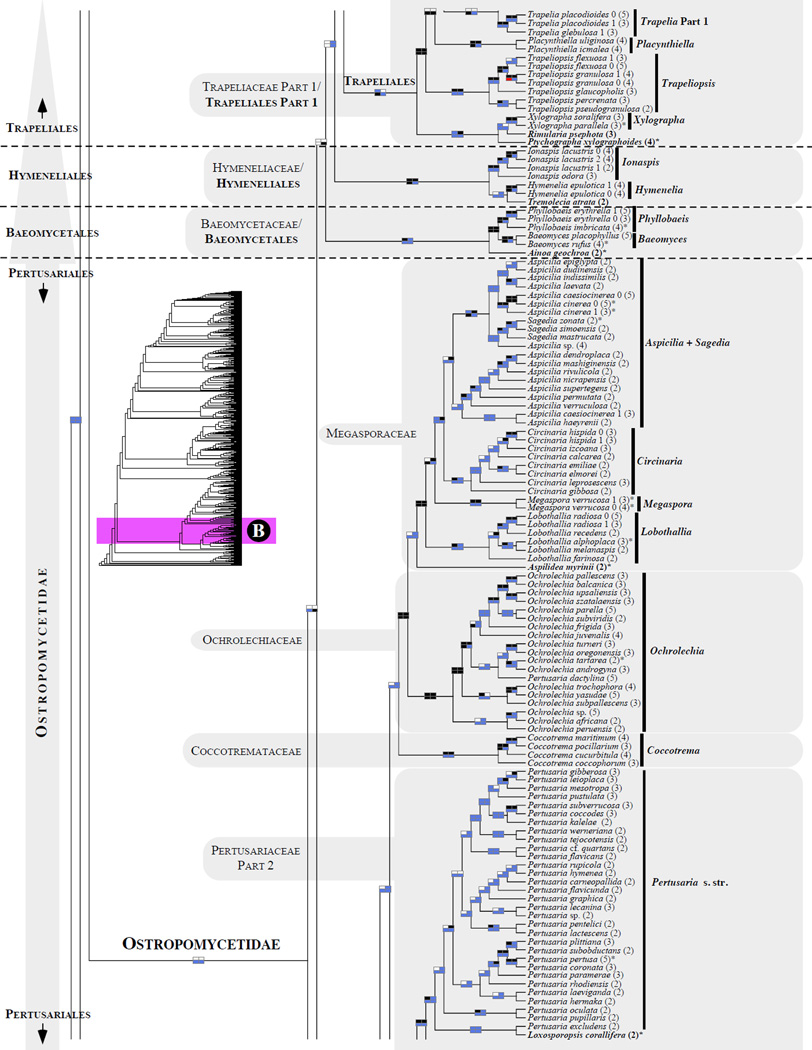
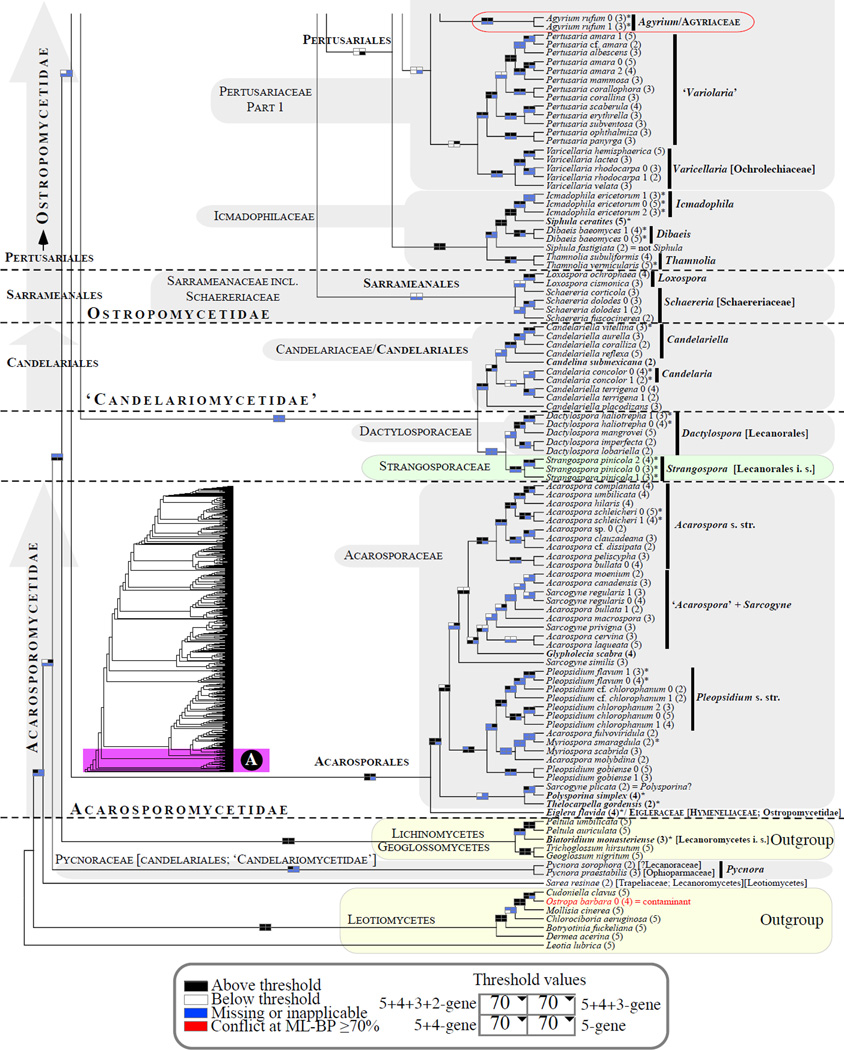
Figure 1.
Phylogenetic relationships among 1307 putative members of the Lecanoromycetes based on maximum likelihood analyses of the combined mitSSU, nucLSU, nucSSU, RPB1 and RPB2 sequences (5+4+3+2-locus dataset) and 10 species used as outgroup (Geoglossomycetes, Lichinomycetes and Leotiomycetes). Numbers in parentheses after taxon names indicate the numbers of genes in our supermatrix for each OTU. Numbers (0, 1, 2) after taxon names indicate presence of multiple specimens from the same taxon. Stars indicate type species. The four-box grids associated with each internode indicate maximum likelihood bootstrap support based on different datasets. Black boxes indicate bootstrap support ≥70%; white boxes indicate bootstrap support <70%; blue boxes indicate cases where internodal support is not applicable due to at least one of the (usually two) immediately downstream branches being absent (due to missing taxa) or the node was not recovered by the bootstrap analysis (not present in the majority-rule consensus tree with all compatible groupings included; 1% treshold); and red boxes indicate conflicting relationships at bootstrap support ≥70%. If in disagreement, the current classification is provided in square brackets. Taxon names in bold indicate that a genus is represented by only one OTU. Grey shadings delimit existing families.Orange shadings highlight new orders. Green shadings delimit new, or potentially, new families. Yellow shadings indicate outgroup taxa. Agyriaceae is delimited by a red line because it is a family embedded within another family (Pertusariaceae). Taxa in red represent obvious phylogenetic misplacements resulting, most likely, from erroneous sequences (see also Supplemental Table S1), misidentified specimens, or stochastic error. Porina guentheri (2) and Ostropa barbara 0 (4) are represented by erronous sequences; Placynthiella oligotropha 0 (3) is represented by an erroneous RPB1 sequence; Chroodiscus coccineus is represented by an erronous nucLSU sequence; Haematomma accolens 0 (3) is represented by an erroneous nucSSU sequence; and H. ochroleucum 0 (2) might represent sterile Lecanora thysanophora. Punctelia subrudecta 0 (2), Hypotrachyna aff. 1 (2), and Lecanora conizaeoides 0 (3), are represented by correct sequences, according to the BLAST searches, and therefore the reason for their unexpected placements is unknown.

