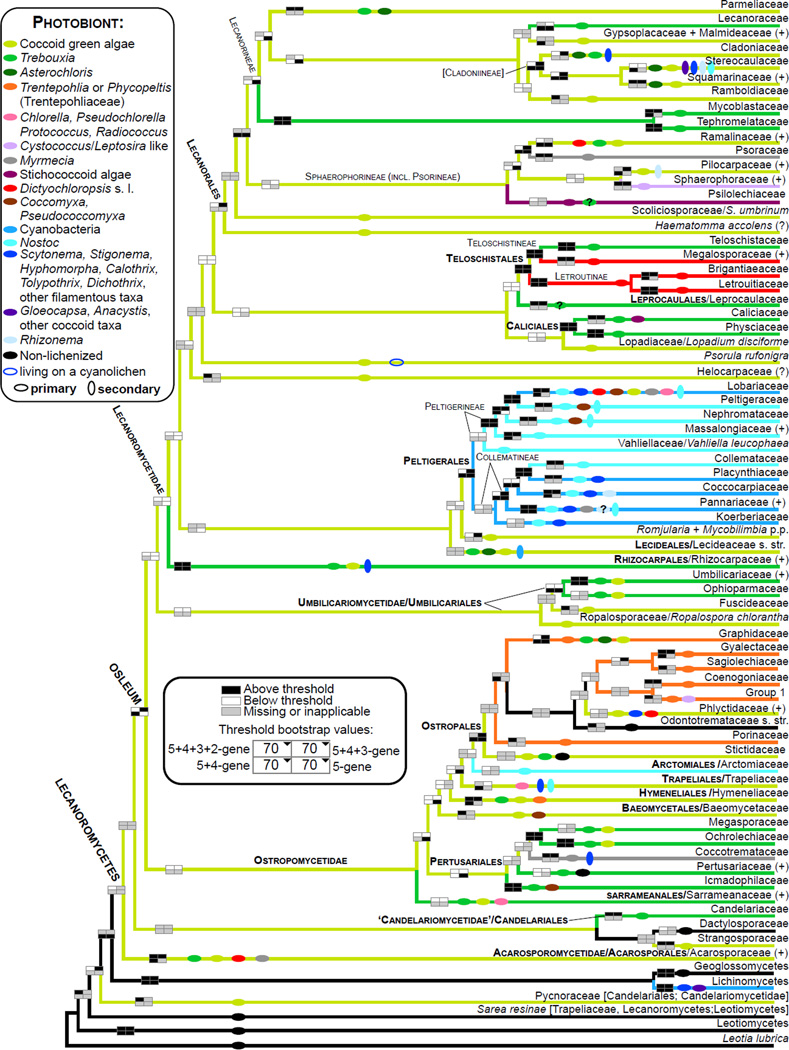
Figure 2.
Schematic cladogram derived from the 5+4+3+2-gene phylogeny (Fig. 1) depicting relationships among major phylogenetic lineages (families and above) reconstructed within the Lecanoromycetes. A plus sign after a taxon name indicates additional species, genera or families included in that lineage (see Fig. 1). Bootstrap support is shown according to the legend and explanation provided for Fig. 1. Colored branches indicate dominant type of primary photobiont and colored horizontal ovals indicate all photobiont groups reported in association with mycobionts within order/family/phylogenetic lineage based on available records for selected members classified in these taxa, even if not present in the tree. Some records of Trebouxia may represent Asterochloris. Presence of secondary photobionts (different genera or families of cyanobacteria) is indicated by vertical ovals. Selected literature used for the photobiont assignment: Backor et al., 2010; Baloch et al., 2010; Beck, 2002; Brodo, 1990; Brodo et al. 2001; Coppins and Purvis, 1987; Dal Grande et al., 2014; Engelen et al., 2010; Fernández-Mendoza et al., 2011; del Hoyo et al, 2011; Friedl and Büdel, 2008; Gueidan et al., 2014; Höggnaba et al., 2009; Kantvilas, 2004; Lücking et al., 2009; Miadlikowska et al., 2006; Muggia et al., 2011; Nash et al. 2002, 2004; Otálora et al., 2010b, 2013c; Peksa and Skaloud, 2011; Purvis et al., 1992; Raggio et al., 2012; Skaloud and Peksa, 2010; Spribille and Muggia, 2012; Tschermak-Woess, 1988; Voytsekhovich, 2013; Voytsekhovich et al., 2011a, b.

