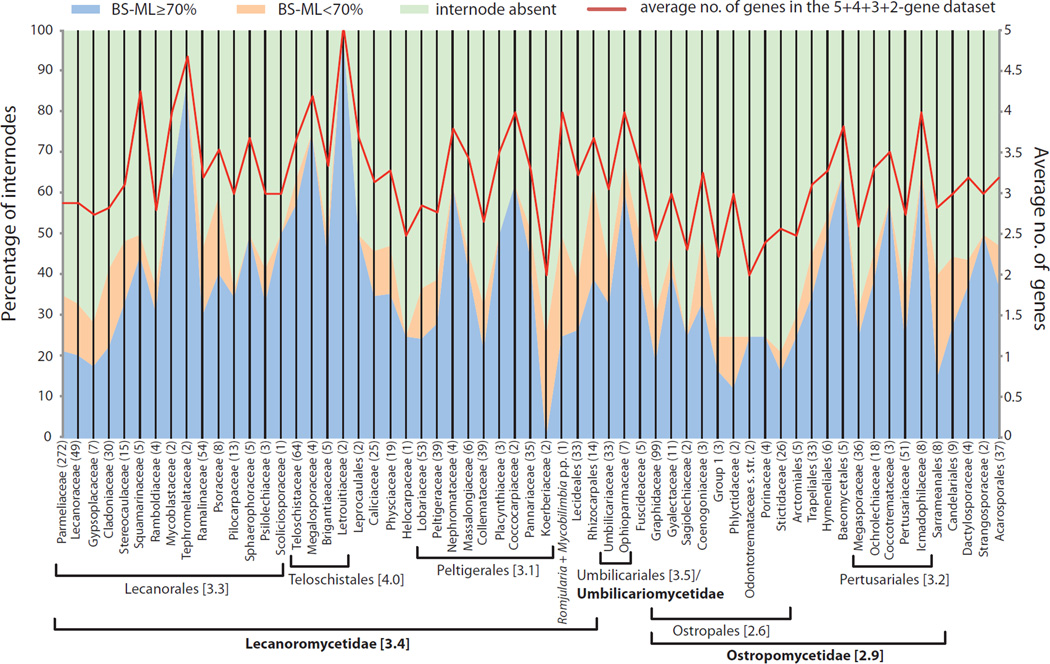
Figure 3.
Comparison between average number of genes (right Y axis and red line) across lineages in the Lecanoromycetes (Fig. 2) and stability of reconstructed phylogenies approximated by the percentage of internodes with BS-ML ≥ 70% (blue shade; corresponding to black boxes in Fig. 1), percentage of internodes with BS-ML < 70% (orange shade; corresponding to white boxes in Fig. 1), and percentage of missing internodes in bootstrap analyses (green shade; corresponding to blue boxes in Fig. 1) (Supplemental Table S2). Numbers in parentheses after taxon names refer to the number of internodes (grids) included in each clade. Average number of sequenced genes are also provided for larger taxonomic entities (orders and subclasses) associated with horizontal brackets.

