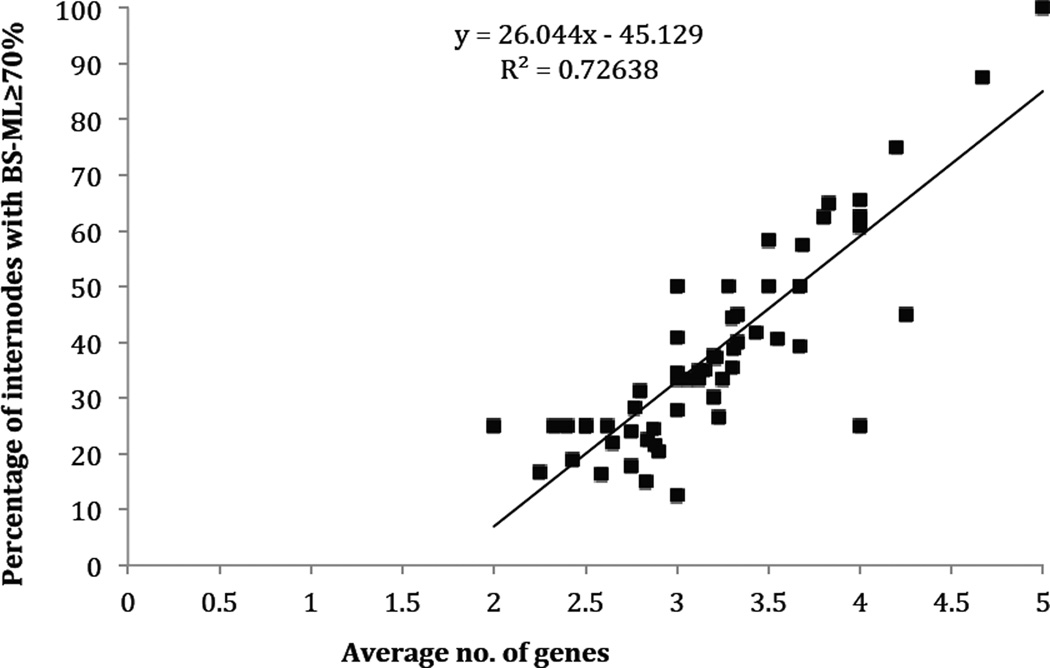
Figure 4.
Strong positive correlation (p < 2.2e-16) between average number of genes included in our supermatrix and the percentage of internodes with BS-ML ≥ 70%, based on results from bootstrap analyses on 5-gene, 5+4-gene, 5+4+3-gene, and 5+4+3+2-gene datasets (i.e. correlation between blue shade and red line in Fig. 3).

