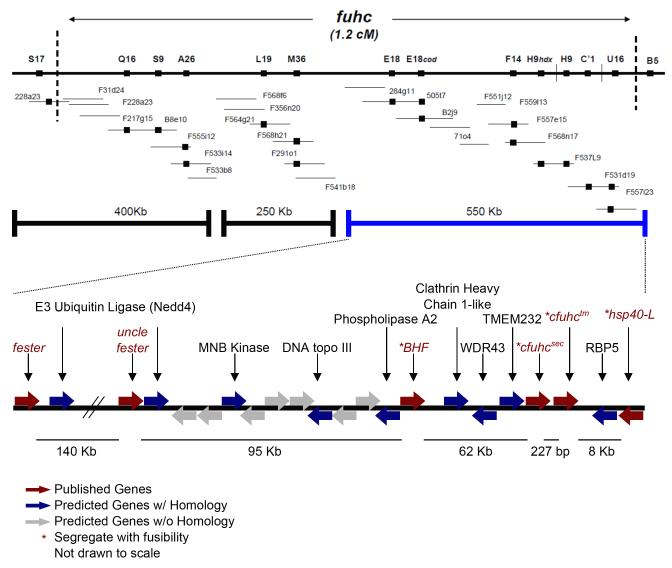
Figure 1.
Schematic of the fuhc locus. Top is a genetic map, with the genomic clones making up the minimal tiling path of the physical map shown below. Specific contigs are represented by bold lines, and the blue line shows the contig in which all polymorphic genes have thus far ben discovered. Predicted genes located in the locus are shown below. Red arrows are putative allorecognition genes, blue arrows are genes with homologs in the NCBI database (with a threshold of e-10), and gray arrows are predicted genes unique to Botryllus. The dotted vertical lines mark the boundaries and genetic markers within a 1.2 cM distance. Black solid boxes represent genetic markers.

