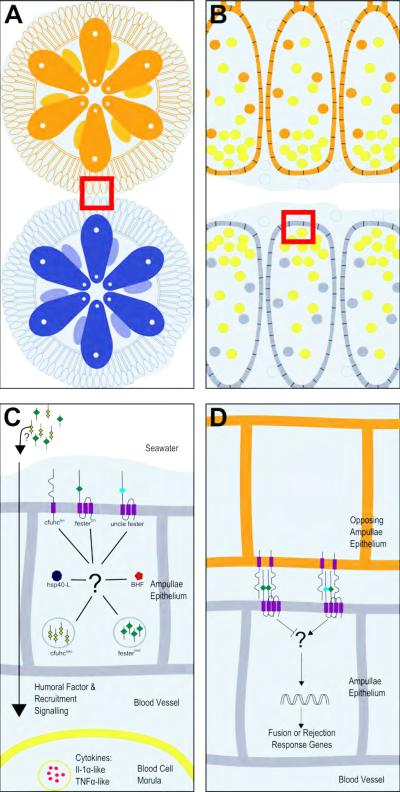
Figure 3.
Cartoon schematic of the initiation of allorecognition. (A) Two individuals (orange and blue) in close proximity of one another. Red box indicates potential interacting ampullae. (B) Magnified region of the red box in (A). Morula cells (yellow dots) are shown accumulating at the ampullar tips. Orange or blue dots represent pigment cells. (C) Magnified region of the red box in (B) with the candidate proteins. (D) A one-way directional portrayal of two interacting ampullae with the speculated candidates.

