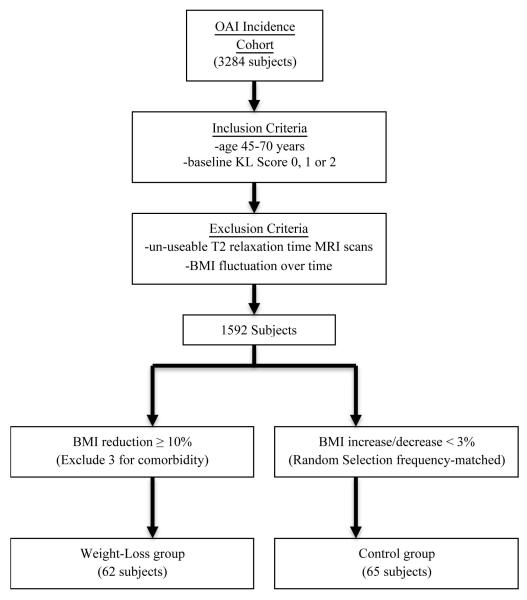
Figure 1.
Schematic illustration showing creation of the subgroups. Sixty-two weight-loss subgroup subjects and sixty five control subgroup subjects were included in this study based on our inclusion & exclusion criteria and weight change classification. OAI = Osteoarthritis Initiative; BMI = body mass index; KL = Kellgren-Lawrence.

