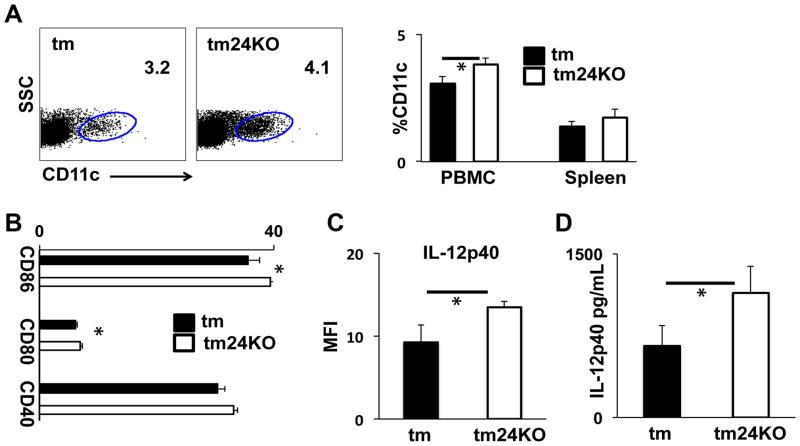
Figure 1. DC activation and IL-12 production in tm and tm24KO mice.
Tm and tm24KO mice were subjected to flow cytometric analysis. (A) Surface staining of peripheral blood CD11c+ single-positive populations gated against SSC. Data of one representative mouse from 3 pairs of mice is shown. Averages of 3 mice per group from PBMC (*=p<0.05) or splenic CD11c+ populations are shown. (B) Single-positive CD11c+ population is gated and surface staining for CD80, CD86, and CD40 populations are gated and represented as average of MFI for 3 pairs of mice, (*=p<0.05). (C) PBMC from tm or tm24KO mice CD11c+ single-positive populations were gated on and intracellular IL-12 production was assessed. Data are graphed as average MFI of n=3 mice per group, (*=p<0.05). (D) Serum level of IL-12p40 at 6 months averaged for 6 pairs of mice, (*=p<0.05).

