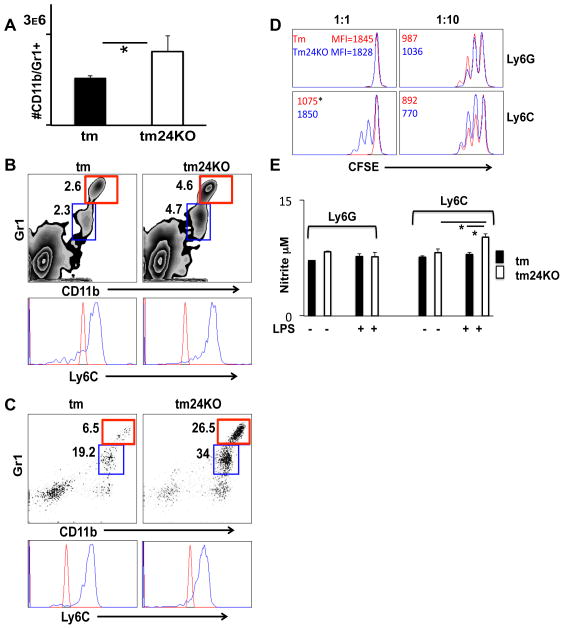
Figure 4. Characterization of MDSC populations in tm and tm24KO mice.
Tm and tm24KO mice were subjected to flow cytometric analysis. Extracellular CD11b+/Gr1+ single-positive populations were gated, except for (D). (A) Spleen cells were counted and total number of Cd11b+/Gr1+ cells was calculated. Graph depicts averages from 3 pairs of mice, (*=p<0.05). (B) Splenic or (C) peripheral blood CD11b+/Gr1high (red) CD11b+/Gr1dim (blue) cells are gated and histogram represents Ly6C+ dim (red) or high (blue) staining of these populations. (D) CD8 T cells, Ly6G+ and Ly6C+ cell fractions were isolated from tm or tm24KO spleens. Effector cells were labeled with CFSE and plated at ratios of 1:1 and 10:1 with strain specific MDSC subsets. CFSE dilution was analyzed by flow cytometry 72 hours later. Representative histograms from 3 separate experiments are shown. Data are presented as average MFI of CFSE (*=p<0.05). (E) Ly6G+ and Ly6C+ cell fractions were isolated from tm or tm24KO spleens and 1×10⁵ cells were plated with or without 1μg/mL LPS for 24 hours. Greiss reaction was performed on cell supernatants (*=p<0.05).

