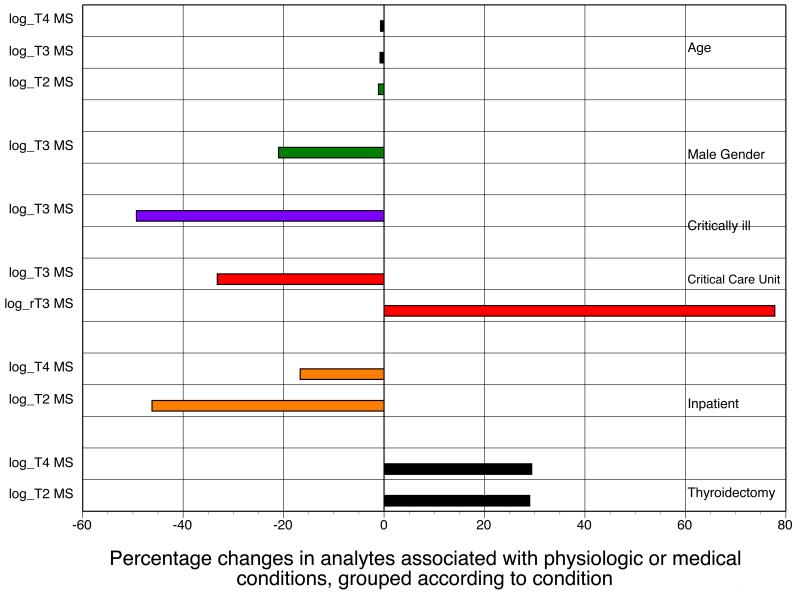
Figure 1.
Multivariate model showing the percentage changes in analytes associated with either physiologic data or medical conditions, grouped according to data or conditions (T2 = 3,3′-T2)
Multivariate model. Percentage is the percentage change in dependent variables for one unit increase for continuous variable (age) or as compared with reference group for categorical variables

