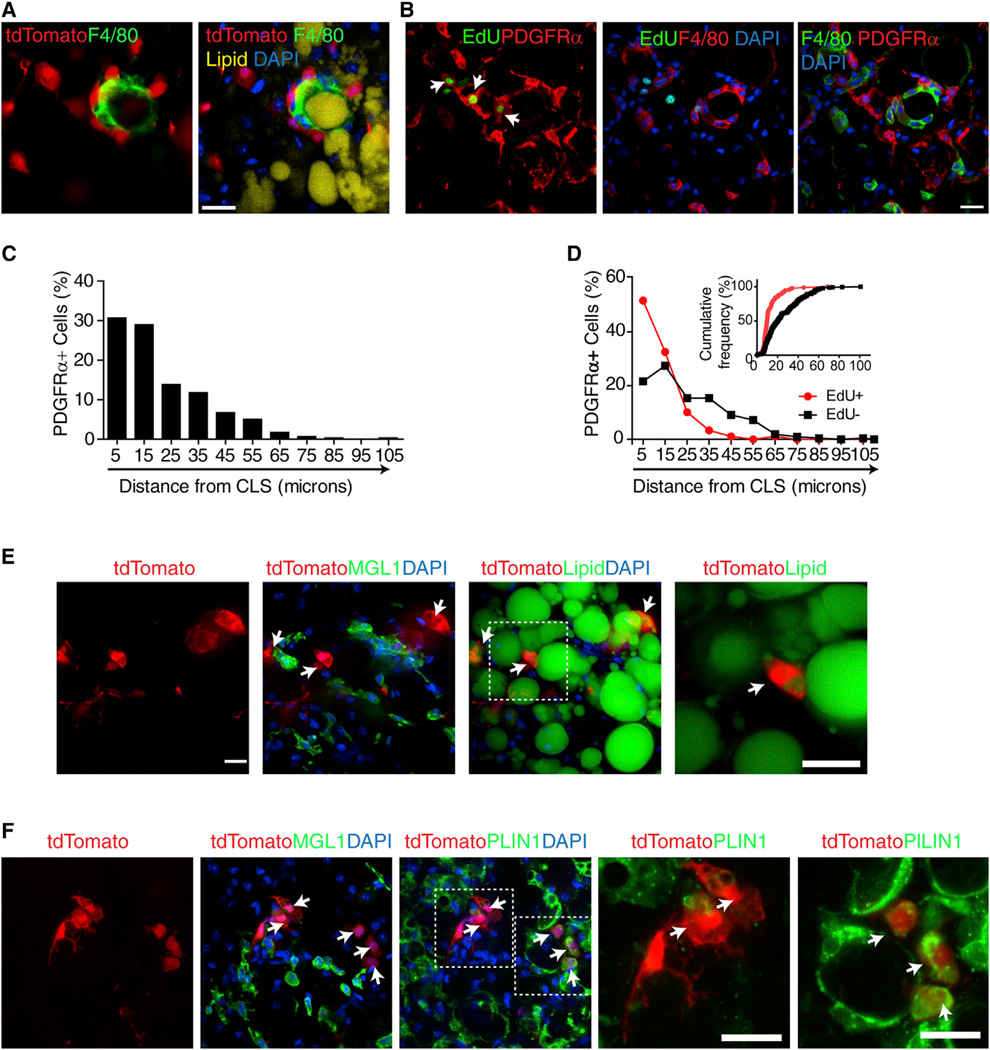
Figure 3. PDGFRα+ Progenitors Are Recruited to CLS, where They Form a Zone of Proliferation.
(A) Confocal images of whole-mount gWAT from tamoxifen-induced Pdgfra-CreERT2/tdTomato mice stained for lipid (LipidTox, yellow) and F4/80 (green), showing close association of PDGFRα+ cells with CLS.
(B) F4/80, PDGFRα, and EdU staining in paraffin sections of gWAT from mice treated with CL for 3 days. Left panel merges images of PDGFRα (red) and EdU (green) fluorescence. Arrows indicate proliferating PDGFRα+ cells. Middle panel is the merged image of F4/80 (red) with EdU (green), showing close association between proliferating cells and F480+ macrophages that form CLS.
(C) Frequency distribution of PDGFRα+ cell density near CLS in gWAT from mice treated with CL for 3 days.
(D) Frequency distribution of proliferating and nonproliferating PDGFRα+ cells near CLS. Bins are centered at 10 µm intervals. Insert shows data plotted as distance versus cumulative frequency.
(E and F) Confocal images of cryosectioned gWAT from tamoxifen-induced Pdgfra-CreERT2/tdTomato mice stained for MGL1 and lipid (E) or PLIN1 (F). Magnified views of boxed regions show that tdTomato+ multilocular adipocytes near CLS were labeled with lipid (E) or PLIN1 (F). Double positive cells are indicated by arrows. Scale bars, 20 µm. Nuclei were counterstained with DAPI (blue). See also Figure S3.

