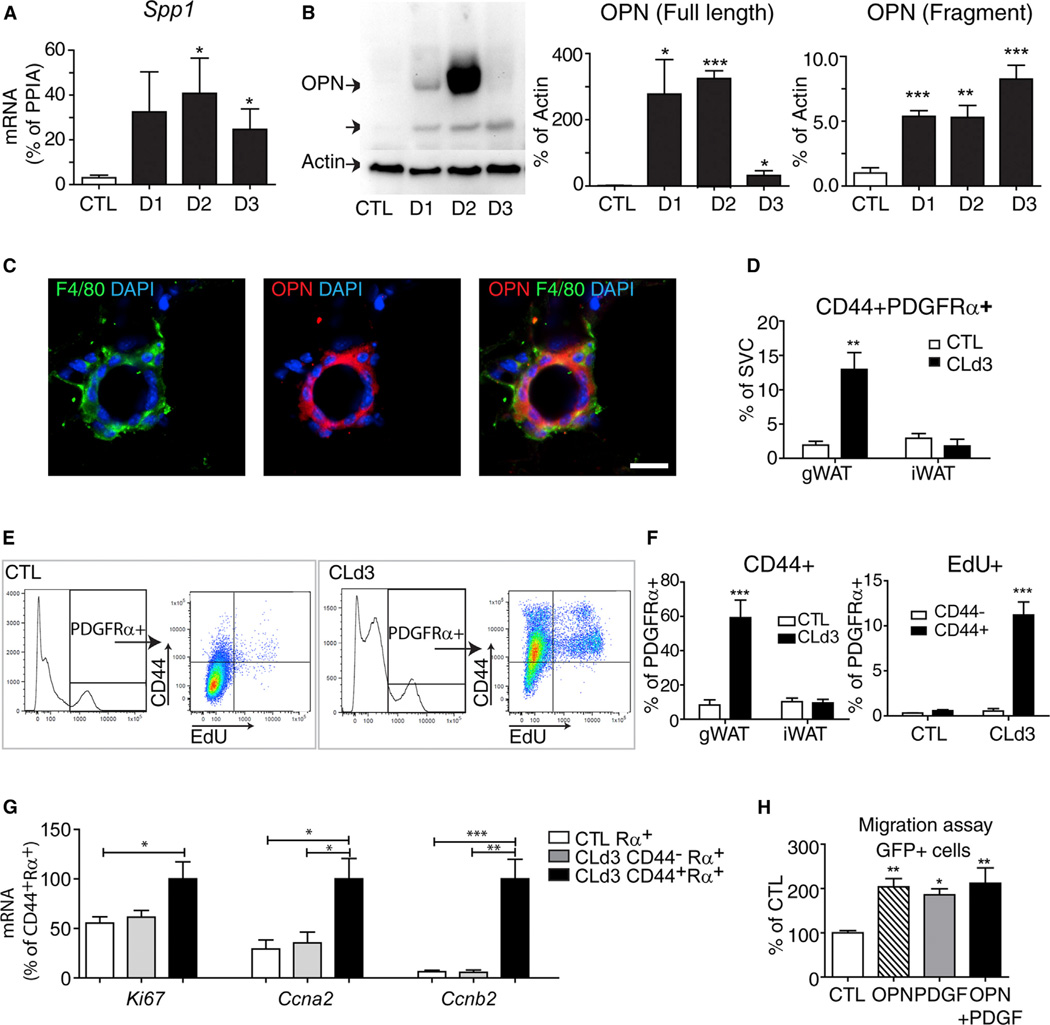
Figure 5. ADRB3 Treatment Upregulates OPN Expression in CLS-Associated Macrophages and CD44 Expression in a Subpopulation of PDGFRα-Expressing Cells.
(A) Quantitative PCR analysis of Spp1 expression in gWAT from control mice and mice treated with CL at indicated days after treatment (mean ± SEM; n = 4–6, *p < 0.05).
(B) Immunoblot analysis of gWAT from control mice and mice treated with CL at indicated points. (mean ± SEM; n = 3–5, *p < 0.05, **p < 0.01, ***p < 0.001). CL increased levels of full-length and cleaved OPN.
(C) Immunohistochemical detection of OPN in F4/80+ cells in paraffin sections of gWAT from mice treated with CL for 3 days. Nuclei were counterstained with DAPI. Scale bar, 20 µm.
(D) FACS analysis of PDGFRα+CD44+ cells in SVC obtained from gWAT and iWAT of control mice and CL-treated mice (mean ± SEM; n = 3, **p < 0.01).
(E and F)FACS analysis of CD44 expression and EdU incorporation in PDGFRα+ cells in SVC of gWAT from control mice and mice treated with CL for 3 days. Mice were injected with EdU 2 hr before sacrifice. (E) Representative flow profiles of each condition are shown. (F) Quantification of CD44+PDGFRα+ cells and EdU+CD44+ cells by FACS (mean ± SEM; n = 3; ***p < 0.001).
(G) Quantitative PCR analysis of proliferation maker expression in FACS-isolated cells from gWAT of control mice or mice treated with CL for 3 days (n = 3–4, mean ± SEM; *p < 0.05, **p < 0.01, ***p < 0.001).
(H) Effect of OPN on in vitro migration of PDGFRα+ cells from Pdgfra-H2BeGFP mice (mean ± SEM; n = 3; *p < 0.05, **p < 0.01). See also Figure S5.

