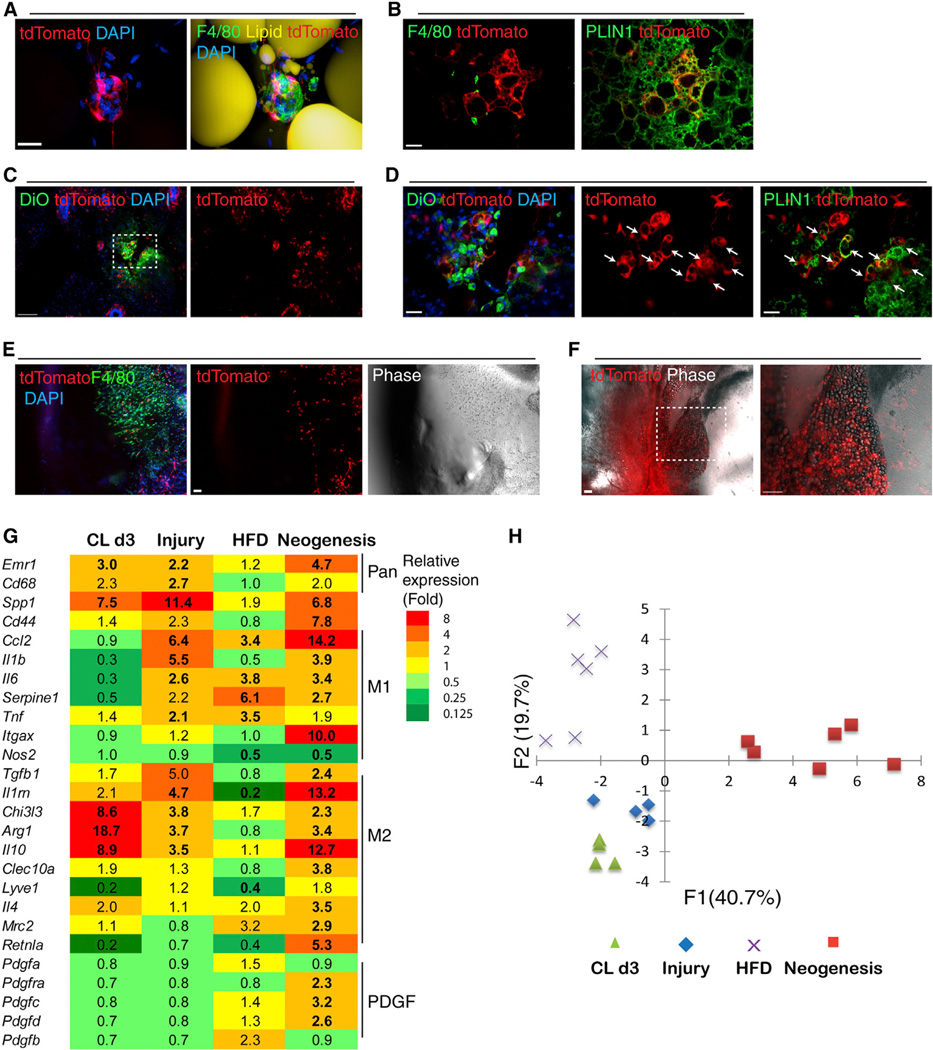
Figure 7. PDGFRα+ Cells Interact with Macrophages in Adult WAT and Contribute to Adipogenesis during Tissue Repair, Tissue Neogenesis, and Nutritional Hyperplasia.
(A) 3D projection images of CLS in iWAT whole mounts from Pdgfra-CreERT2/tdTomato mice fed HFD for 8 weeks.
(B) tdTomato+ adipocyte clusters that were found in iWAT of HFD-fed mice were not associated with CLS.
(C and D) Needle injury induced the appearance of tdTomato+ adipocyte clusters in iWAT. Shown are cryosections of Pdgfra-CreERT2/tdTomato mice 10 days after needle injury. (D) A magnified view of the boxed region from (C). Injured sites were marked with DiO (green, left). tdTomato+ multilocular adipocytes (arrows) contained PLIN1+ lipid droplets.
(E and F) Representative confocal images of Matrigel plugs 7 days or 4 weeks after injection. (E) tdTomato+ progenitors and F4/80+ macrophages were the major cells infiltrating Matrigel plugs 7 days after injection. (F) Numerous tdTomato+ adipocytes formed 4 weeks after Matrigel injection.
(G) Heatmap showing the unique gene expression profiles of macrophage-associated genes under different adipogenic conditions. Gene expression values are relative to each control condition. (n = 4–6; bold, p < 0.05).
(H) PCA score plot illustrates distinct gene expression profiles across adipogenic conditions (CLd3, gWAT of mice treated with CL for 3 days; injury, iWAT of mice 3 days after needle injury; HFD, gWAT of mice fed HFD for 8 weeks; neogenesis, Matrigel plug 7 days after injection). Scale bars, 20 µm in (A), (B), and (D). Scale bars, 100 µm in (C), (E), and (F). See also Figure S7.

