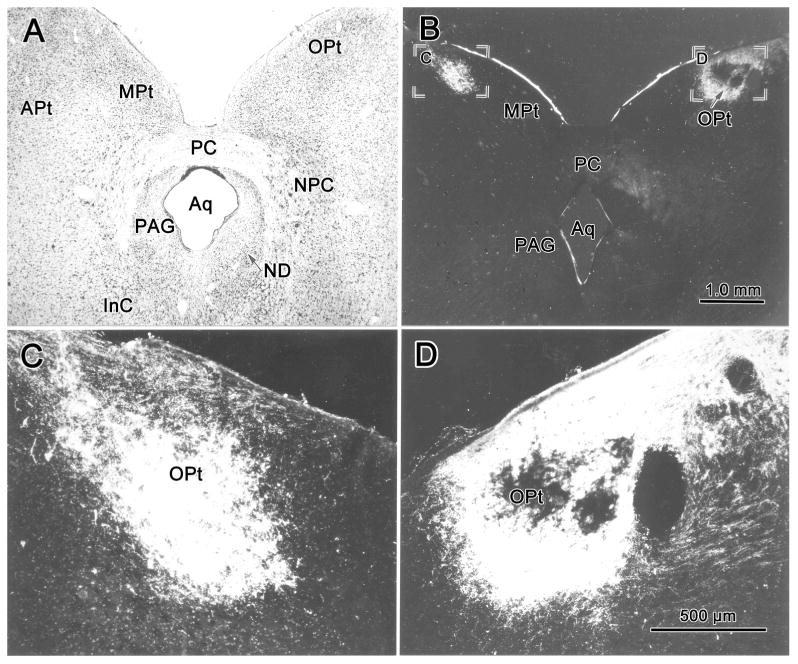
Figure 1.

Brightfield (A) and darkfield (B-D) photomicrographs demonstrating the olivary pretectal nucleus (OPt) and the pattern of labeling in this nucleus following a WGA-HRP injection of the left vitreous chamber. Anterogradely labeled retinal terminal fields were heavier on the right (contralateral) side (B&D) than the left (ipsilateral) side (B&C). A Nissl-stained section (A) at about the same level as B shows the cytoarchitecture of OPt and adjacent structures for reference. Scale in A=B, C=D.
