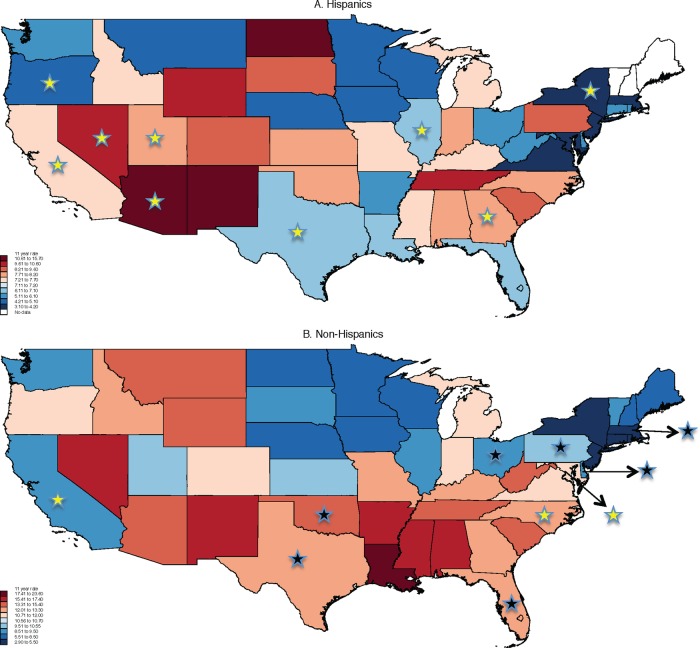
Figure 3.
Firearm-related fatality rates from 2000 to 2010 according to ethnicity. Hispanic: firearm-related fatality rates are 11-year cumulative age-adjusted rates per 100 000 persons from 2000 to 2010 for each of the 50 states and District of Columbia (DC); ranging from 3.13 (New Jersey) to 15.63 (North Dakota) per 100 000. The colours represent increasing rates from blue to red. White represents no data or states where the frequency was <10 among Hispanics. Significant decline in nine states (California (CA), Arizona, Nevada, Oregon, Utah, Texas (TX), Illinois, Georgia and New York) are represented as gold stars and there were no states with significant increase. Hawaii (HI; 11-year=3.84) and Alaska (AK; 11-year=8.95) are not represented in the map. Non-Hispanic: firearm-related fatality rates are 11-year cumulative age-adjusted rates per 100 000 persons from 2000 to 2010 for each of the 50 states and DC; ranging from 2.95 (HI) to 23.45 (DC) per 100 000. The colours represent increasing rates from blue to red. White represents no data or states where the frequency was <10 among non-Hispanics. Significant decline in three states (CA, North Calorina and DC) are represented as gold stars and significant increase in seven states (TX, Oklahoma, Florida, Ohio, Pennsylvania, Delaware and Massachusetts) as black stars. HI (11-year=2.95, change=−0.05, p trend=0.50) and AK (11-year=18.44, change=0.13, p trend=0.57) are not represented in the map.

