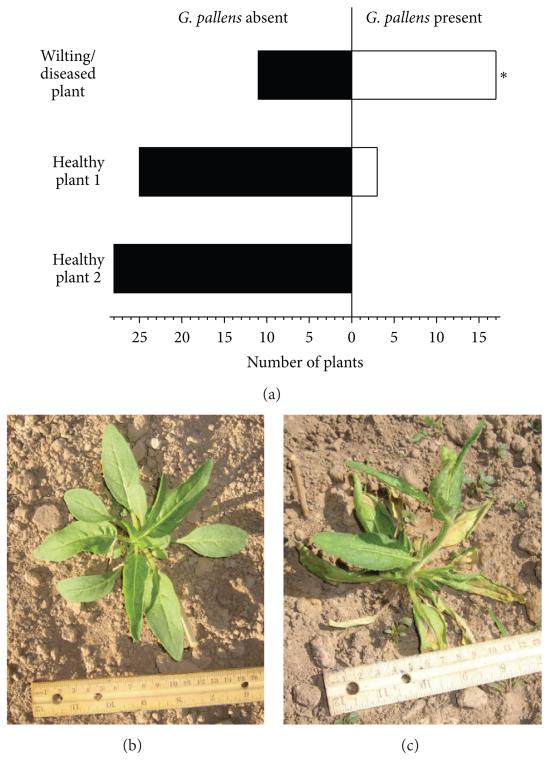
Figure 7. G. pallens is more likely to be found on wilting plants.
The graph shows the number of wilting, diseased, and neighboring healthy plants found to harbor G. pallens individuals (a). Healthy plant 1 (b) was on average ca. 1.5 m, and healthy plant 2 was ca. 2-3 m away from the wilting plant (c). The asterisk indicates significant differences between the presence of G. pallens in both sets of healthy plants and wilting plants in a Fisher’s exact test, P < 0.0001.

