Figure 4.
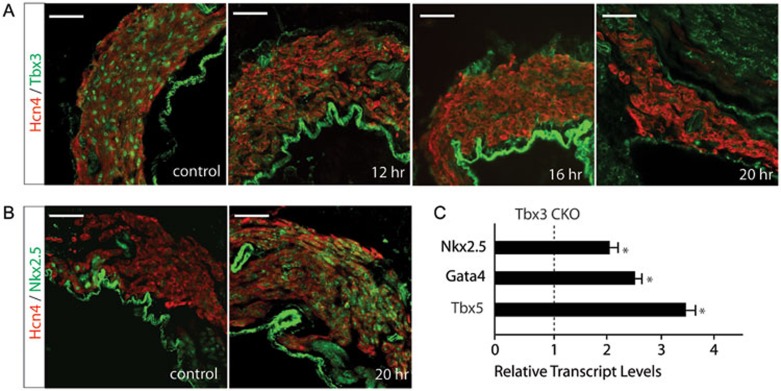
Deletion of Tbx3 in the SAN led to increased expression of Nkx2.5. (A) Protein levels of Tbx3 in the SAN after tamoxifen induction in Tbx3f/f;Hcn4CreERT2 mice. Scale bar, 50 μm. (B) Enhanced expression of Nkx2.5 in the SAN after tamoxifen induction in the Tbx3 CKO mice. Scale bar, 50 μm. (C) qPCR to show relative transcript levels of Nkx2.5, Tbx5, and Gata4 at 20 h after tamoxifen induction in Tbx3 CKO mice (n = 3 in each group). *P < 0.05.

