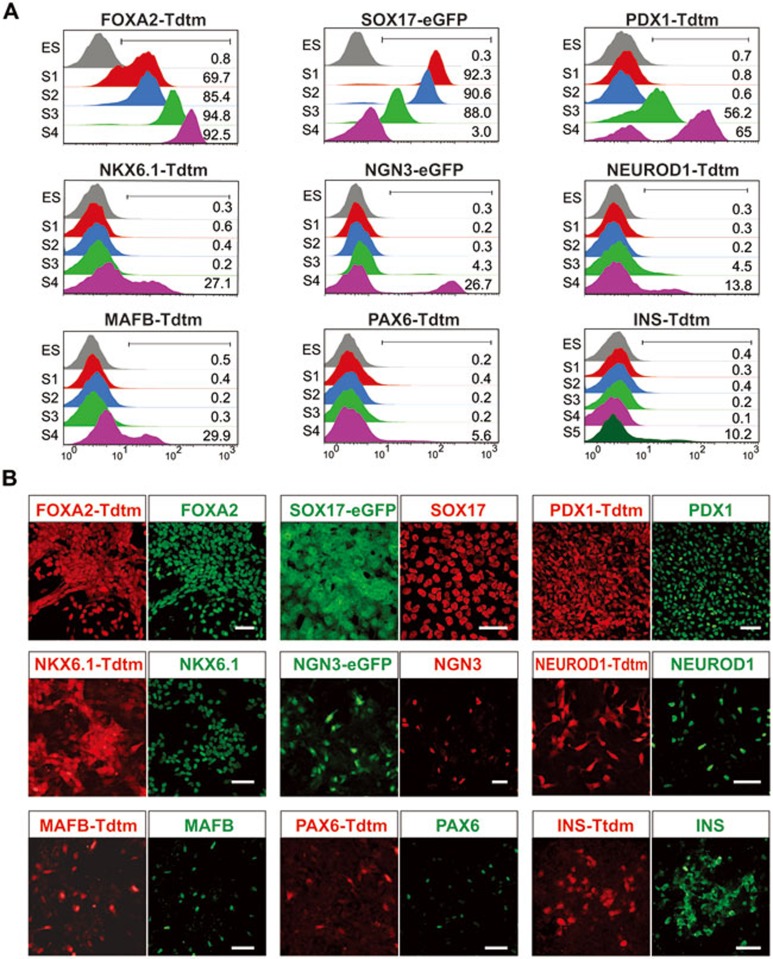
Figure 2.
Expression dynamics and fidelity of individual reporter genes. (A) Flow cytometric analysis of the expression dynamics of individual reporter genes during hESC differentiation. The cell cultures were analyzed by flow cytometry at the end of each stage. The expression of FOXA2-Tdtm, SOX17-eGFP, PDX1-Tdtm, NKX6.1-Tdtm, NGN3-eGFP, NEUROD1-Tdtm, MAFB-Tdtm and PAX6-Tdtm was measured for stages (S) 1-4; whereas INS-Tdtm for S1-S5. The numbers in the figure indicate percentage of reporter-expressing cells at the end of specific stages. (B) Confocal imaging after co-staining of reporter gene expression with endogenous gene expression. The expressions of FOXA2-Tdtm and SOX17-eGFP were analyzed at S1, day (D) 4; PDX1-Tdtm at S3, D4; NGN3-eGFP was analyzed at S4, D1.5; NKX6.1-Tdtm and NEUROD1-Tdtm were analyzed at S4, D3; MAFB-Tdtm was analyzed at S4, D4; PAX6-Tdtm was analyzed at S4, D5, and INS-Tdtm at S5, D5. The endogenous protein staining is pseudocolored, and the eGFP expression of the dual-reporter cell lines is not shown. The superimposed images are shown in Supplementary information, Figure S2D. Scale bar, 50 μm. Abbreviations: INS (INSULIN); Tdtm (TdTomato).

