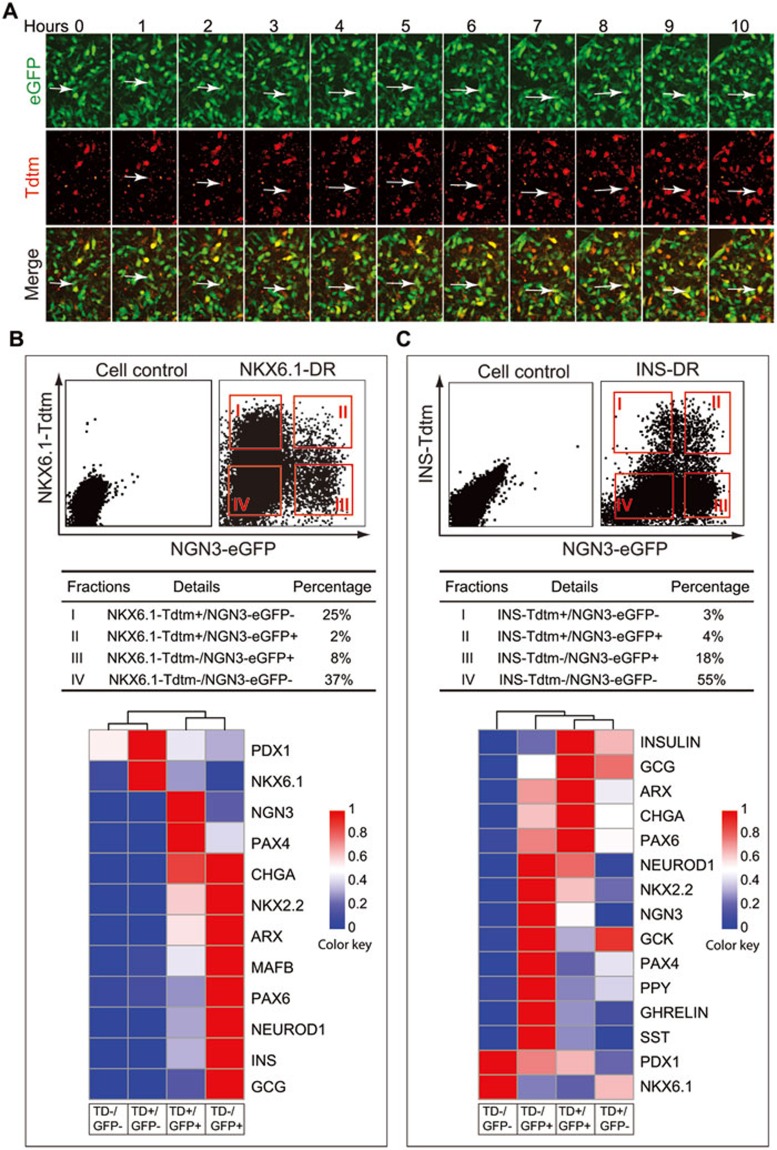
Figure 5.
Capture of cell-fate transitions and characterization of cell subpopulations using dual-reporter cell lines. (A) Real-time tracing of NEUROD1-DR cell cultures at stage 4 day 2 implies that NEUROD1-Tdtm+ cells were derived from NGN3-eGFP+ cells. The arrows indicate newborn Tdtm+ cells. (B) Q-PCR analysis of gene expression in isolated cell subpopulations from NKX6.1-DR cell cultures at the end of stage 4. (C) Q-PCR analysis of gene expression in isolated cell subpopulations from INS-DR cell cultures at the end of stage 5. Gene expression values in B and C were first normalized to GAPDH, and then the highest expression value of each gene among the corresponding group of cell subpopulations was set to 1. The color scale indicates the normalized expression values. Abbreviations: INS (INSULIN); Tdtm (TdTomato); Td (TdTomato); GFP (eGFP).

