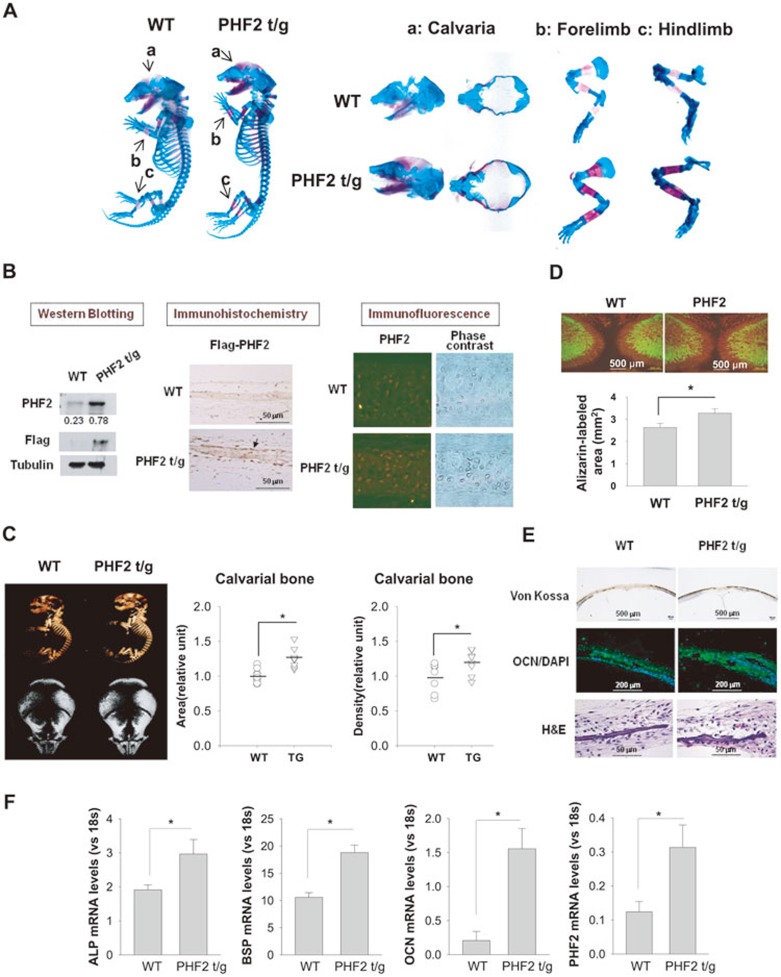
Figure 1.
PHF2 facilitated bone development in mice. (A) Bones and cartilages of Flag-PHF2-t/g mice and their littermates on postnatal day 1 (P1) were stained with Alizarin Red (red color) and Alcian Blue (blue color), respectively. The left panel shows the representative results for whole skeletons, and the right panel shows calvaria (a), forelimb (b), and hindlimb (c). (B) The expression of transgenic Flag-PHF2 in mouse calvarias on P1 was checked by immunoblotting with anti-PHF2 or anti-Flag antibody (left panel), by immunohistochemistry with an anti-Flag antibody (middle panel), and by immunofluorescence with an anti-PHF2 antibody (right panel). The densities of PHF2 and β-tubulin blots were quantified using the ImageJ program and the PHF2/tubulin ratios are presented below the PHF2 blot. An arrow indicates a Flag-PHF2-expressing osteoblast in the periosteum. (C) The left panel shows the micro-CT images of bodies (top) and calvarias (bottom) of PHF2-t/g mice and their wild-type littermates on P1. Based on micro-CT images, calvarial bone areas and densities were analyzed using the ImageJ1.36b software (NIH: Maryland, MD) and plotted in the right panels. Horizontal bars represent mean values, and * denotes P < 0.05 for the indicated groups. (D) Bone formation in PHF2-t/g mice and their littermates (WT) on P1 was detected by double labeling with Calcein (green) and Alizarin (red). The area of Alizarin-labeled tissue, which indicates bone formed newly for two days before birth, was analyzed using ImageJ and plotted in the bottom panel. Data shown represent the mean ± SD (n = 3) and * denotes P < 0.05. (E) In calvarias of mice on P1, mineralization, OCN expression and histology were analyzed by Von Kossa staining, immunofluorescence with anti-OCN antibody and H&E staining, respectively. (F) The mRNA levels of the osteogenic genes (ALP, BSP, and OCN) and PHF2 in calvarias were analyzed by RT-qPCR and were normalized to 18S RNA levels. Data shown represent the mean ± SD (n = 4) and * denotes P < 0.05.

