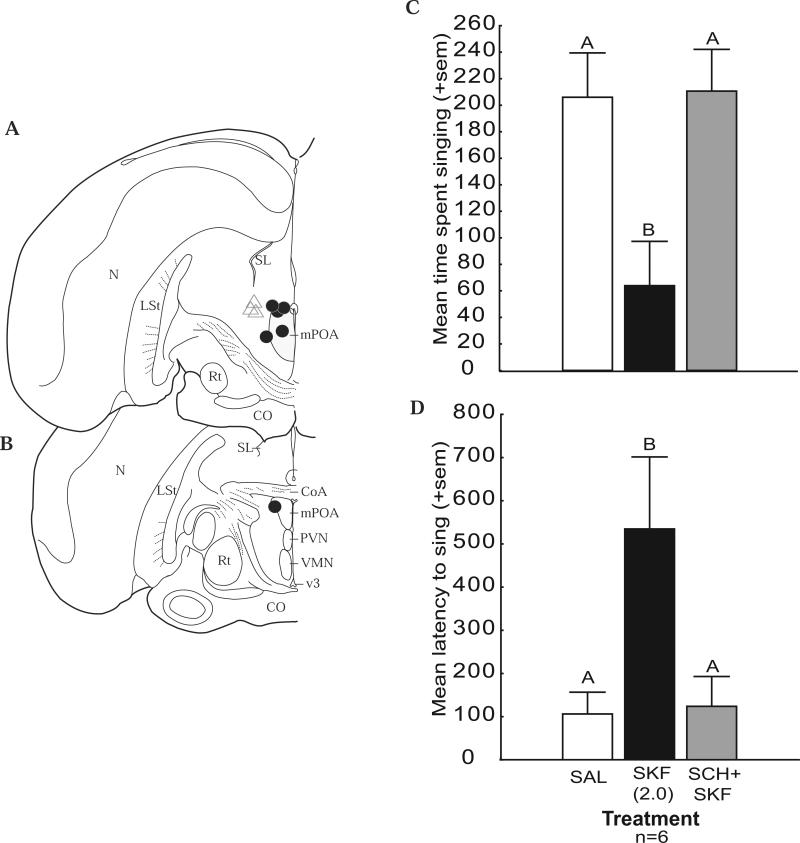
Figure 3.
Effects on singing behavior induced by a D1 agonist are blocked by a D1 antagonist. A and B) Locations of the cannula tip for each bird in coronal sections of one hemisphere of the starling brain. Circles represent experimental animals for which the site of injection was centered in mPOA. Triangles represent control animals for which the site of injection was centered outside of mPOA and approximately 50 microns rostral to the dark at the level of the tractus septomesencephalicus. See Figure 1 for abbreviations. C - D) Bar graphs illustrating effects of saline (SAL), the D1 receptor agonist SKF 38393 (SKF; 2.0 μg), and co-administration of the D1 selective antagonist SCH 23390 (SCH; 2.0 μg) plus SKF on measures of sexually-motivated male song. Sample size is indicated at the bottom of the figure. Different letters above bars indicate significant differences resulting from post hoc comparisons (p < 0.05).

