
Fig. 2. CendR endocytosis is mechanistically distinct from known endocytic pathways.
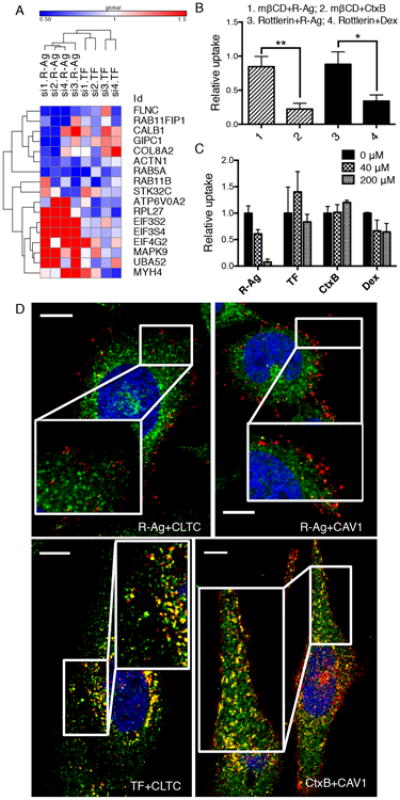
(A) The effect of knocking down selected hit genes from the genome screen on R-Ag and TF uptake using individual siRNAs format. The values represent relative probe uptake normalized to that of negative controls (which is 1, Supplementary Data 2). The heat-map and clustering analysis were generated using Gene-E (Broad institute).
(B) R-Ag uptake is not affected by Cav-ME and MP inhibitors. PPC1 cells were treated with indicated inhibitors (mβCD or Rottlerin) followed by testing for probe uptake (R-Ag, CtxB or Dex) as described in Methods. The fluorescence intensity of each probe was normalized to the average of the corresponding negative controls (vehicle alone) as relative uptake (y-axis). *P<0.05 and **P<0.01 (Student's t-test).
(C) CendR cargo does not compete with other endocytic pathways. Unlabeled CendR peptide, RPARPAR-OH, was added to culture media of PPC1 cells at the indicated concentrations (upper right corner) 10 min prior to addition of fluorescently labeled endocytic probes (x-axis). The intensity of probe signal was normalized to the average of untreated cells (0 μM) as relative uptake (y-axis).
(D) R-Ag does not colocalize with structural components of CME and Cav-ME vesicles. PPC1 cells were incubated with R-Ag, TF-594 or CtxB (red) for 15 min before washing and fixation. CLTC and CAV1 proteins were detected with rabbit anti-CLTC and anti-CAV1 antibodies, followed by staining with anti-rabbit secondary antibody (green). Nuclei were labeled with Hoechst 33342 (blue). Representative images captured by confocal microscopy are shown. The colocalization events between two probes were identified with the “colocalization highlighter” macro for Image J and shown in yellow. Scale bar, 10 μm. Error bars indicate SEM (3-5 replicates).