
Fig. 7. Nutrient regulation of CendR uptake in physiological context.
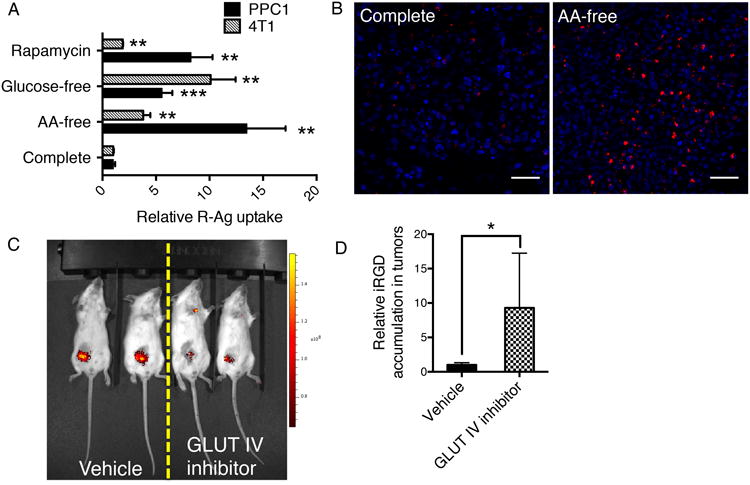
(A) CendR uptake in live tumor slices responds to nutrient availability. Live tumor tissue slices (PPC1 xenografts; 4T1 mouse mammary tumors) were obtained and incubated under the indicated conditions (y-axis) for 6 h. The slices were then suspended in the same kind of media containing 15 pM R-Ag, and incubated for another two hours at 37°C with gentle shaking on a rocker before etching and fixation. The fluorescence intensity of R-Ag per cell was quantified using ImageJ, normalized to slices cultured in complete media and shown as relative uptake (x-axis). **P<0.01 and ***P<0.001 (Student's t-test) in comparison to complete media conditions of the corresponding tumor types. Error bars indicate SEM (4-7 replicates).
(B) Representative images of R-Ag internalization into PPC1 tumor slices. R-Ag, red; nuclei, blue. Scale bar, 50 μm.
(C) Representative image of glucose uptake into 4T1 tumors after GLUT IV inhibitor treatment. Mice bearing 4T1 tumors were treated with intratumoral injections of vehicle only or GLUT IV inhibitor as described in Methods. IRDye 800CW 2-deoxy-D-glucose (2-DG) in 10 nmol in 100 μl PBS was then injected intravenously into a tail vein and 24 h later, the fluorescence intensity of 2-DG was captured using Xenogen IVIS 200 imager (PerkinElmer Inc.). The experiment was conducted twice with at least three mice per group.
(D) iRGD accumulation in tumors responds to glucose deprivation. FAM (fluorescein)-labeled iRGD (200 μg in 100 μl PBS) was intravenously injected into mice bearing 4T1 tumors treated with vehicle alone or with the GLUT IV inhibitor. After 2 h of circulation, the mice were perfused with PBS containing 1% BSA to remove peptide remaining in the circulation. The tumors were excised, fixed and sectioned. FAM-iRGD in the tumors was detected with rabbit anti-FITC antibody. The average signal intensity per cell was normalized to vehicle-treated tumors as relative uptake. The experiment was conducted twice with at least three mice per group, and error bars indicate SEM. *P<0.05 (Student's t-test).