Figure 4.
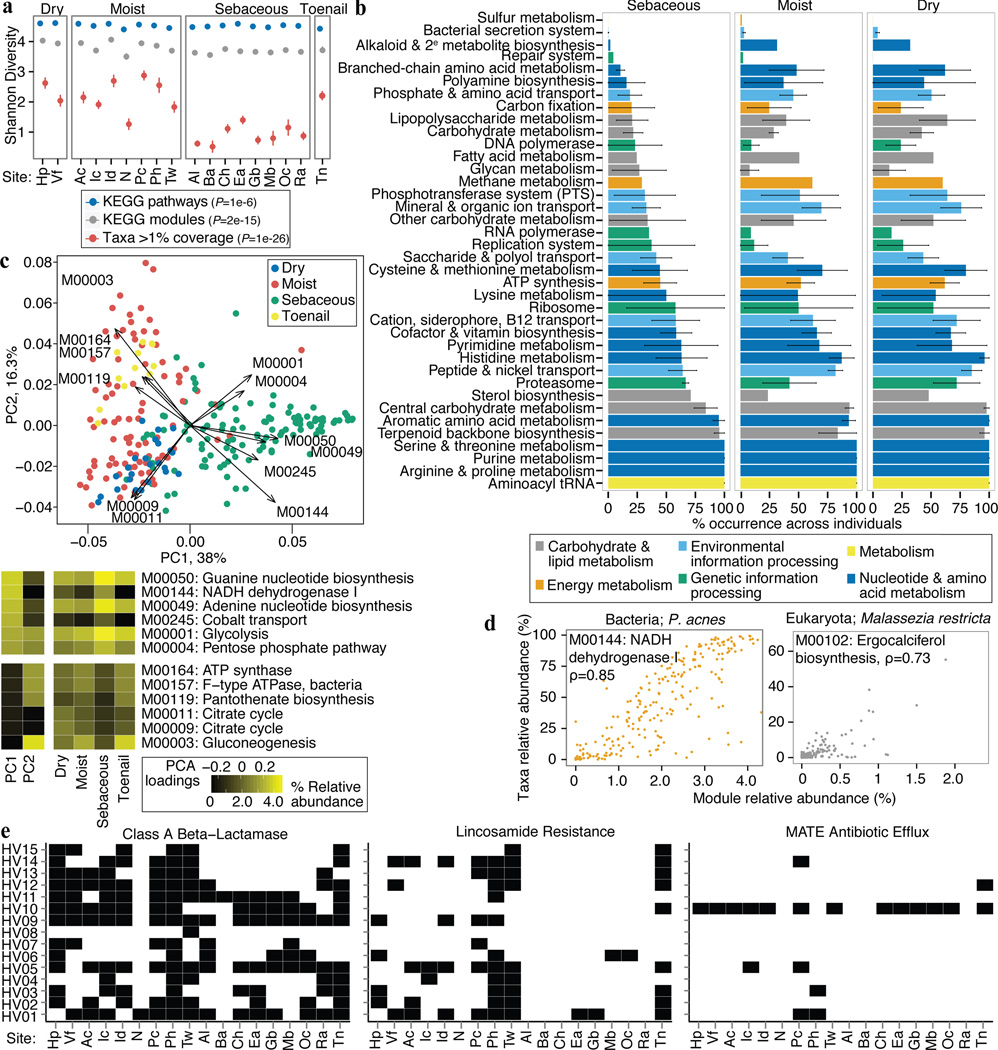
Functional capacity varies by microenvironment. a, Shannon diversity of functional pathways and taxonomy by site; P-value, Kruskal-Wallis test between microenvironments. Error bars: standard error of the mean. b, Microenvironments possess different core modules; ‘core’ = occurrence in > 2/3 of samples. Error bars show variation within a class of modules (full version in Extended Data) that may arise from a unique specialization for that microenvironment. c, PCA shows clustering by microenvironment, with strong separation of sebaceous, dry, and toenail modules. Heatmaps: left, loadings for the first two PCs; right, mean relative abundances for modules with the greatest variation by microenvironment. d, A module’s taxonomic origin can be imputed by Spearman correlation (ρ; adjusted P ≤ 2e-16) with P. acnes and M. restricta relative abundances. e, Presence of select antibiotic resistance gene families by individual and site.

