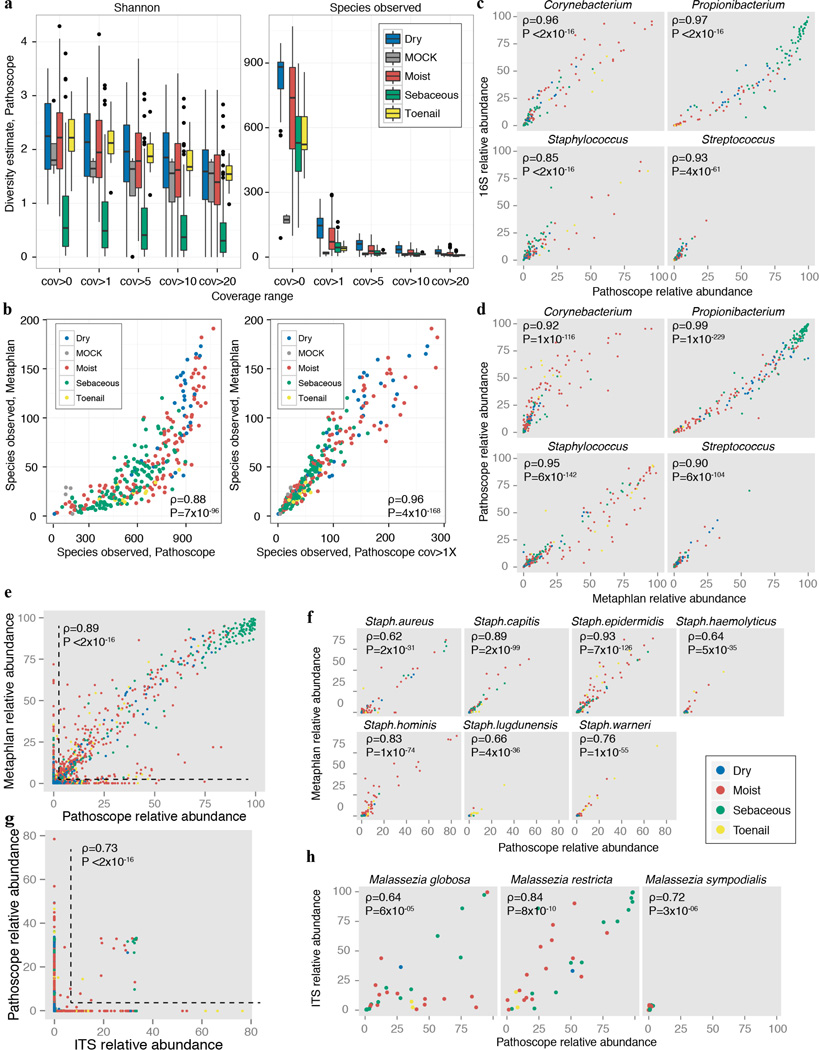
Extended Data Figure 3.
Validation of taxonomic classifications. a, Bacterial sample community diversity as a function of genome coverage for two diversity metrics, the Shannon index that measures the richness and evenness of the community (left), and # species observed (right). Genome coverage is defined as for each genome hit, the % of genome covered by reads. Boxplots show the range of diversity values for all samples, segregated by microenvironment. Black lines indicate median; boxes represent first and third quartiles. As coverage cutoffs increase, diversity estimates drop sharply. b, Comparisons of bacterial community diversity for Metaphlan-derived classifications vs. custom bacterial Pathoscope-derived classifications. Each point represents a different sample, colored by microenvironment. With no coverage cutoffs (left), Pathoscope may overestimate diversity, which is reduced by setting a minimum 1× coverage requirement. Spearman correlation (ρ) and corresponding P-values are shown. Pathoscope-derived relative abundances versus relative abundances derived from c, 16S amplicon sequencing, d, Metaphlan genus-level, e, Metaphlan-species level (ρ & P-value are calculated for non-zero abundance taxa) f, Metaphlan, staphylococcal species, g, ITS1 amplicon sequencing, genus (ρ & P-value are calculated for non-zero abundance taxa) and h, ITS1 amplicon sequencing, Malassezia species.

