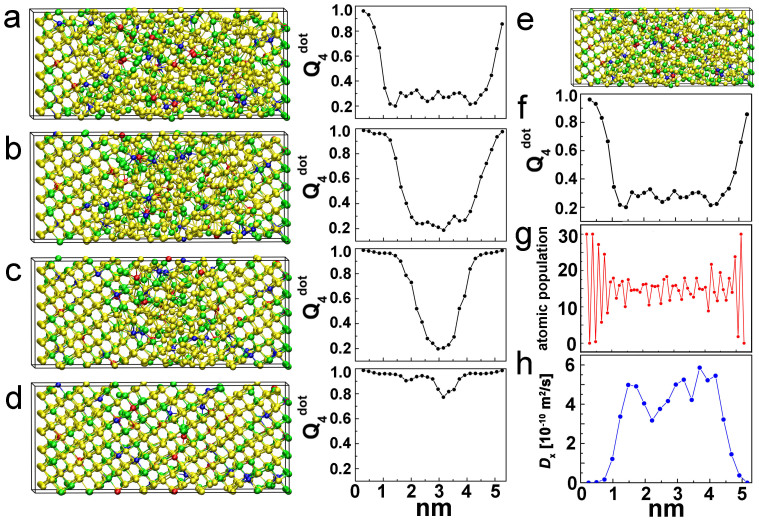
Figure 2.
(a)–(d) Snapshots of the crystallization process (at T = 585 K) at 0, 60, 120 and 170 ps and corresponding Qdot4 profiles. Ag, In, Sb and Te atoms are rendered with blue, red, yellow and green spheres respectively. Qdot4 is averaged both over the atoms within each slab and over time (0.6 ps). (e) Snapshot at the initial stage of crystallization and corresponding Qdot4 profile (f), atomic population profile (g) and diffusivity Dx profile (h). The atomic population is obtained by computing the total number of atoms in each slab, averaged over 0.6 ps. The profile of Dx is derived from the mean-square displacements in x-direction, which are calculated by averaging over the atoms in each slab and over time (30 ps).

