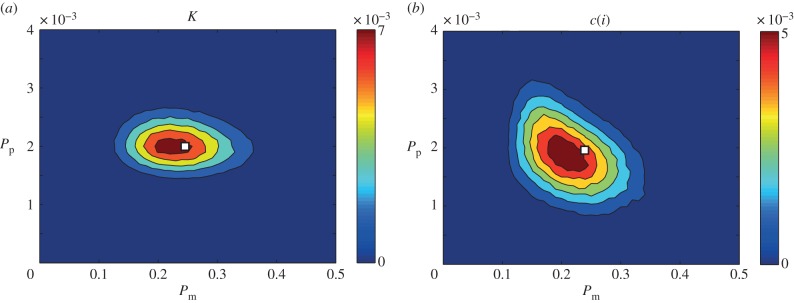
Figure 3.

Averaged posterior distributions calculated using summary statistics obtained simulations as prepared in figure 2 for (a) K, a combination of the pair correlation function q(i) and the number of cells N, and (b) the counts of pair distances c(i), as a summary statistic. The details of the process to obtain the distributions are given in the electronic supplementary material. Parameter values used were (a)  and (b)
  . For all simulations τ = 1/24 h, Γ = (10−1, 10−3), M = 106, N(0) = 100, Y0 = 10. The white squares represent the parameter values used to generate the synthetic data. For further details about the parameters, see figure 2.
