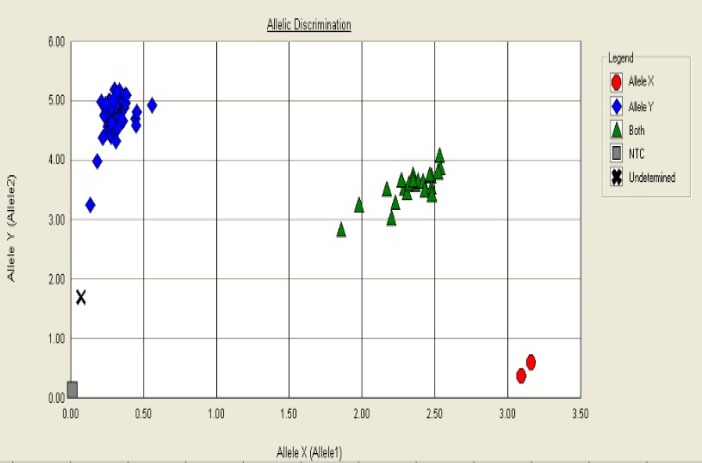
Figure 1.
Allelic discrimination plot represents genotypes with four symbols (squares, diamonds, triangles, circles and multiplication sign) for NTC sample, TT, CT, CC, and undetermined genotypes respectively. The x-axis is amount of emission for flourophore channels (FAM) and on the y-axis represents emission for flourophore channels (VIC).

