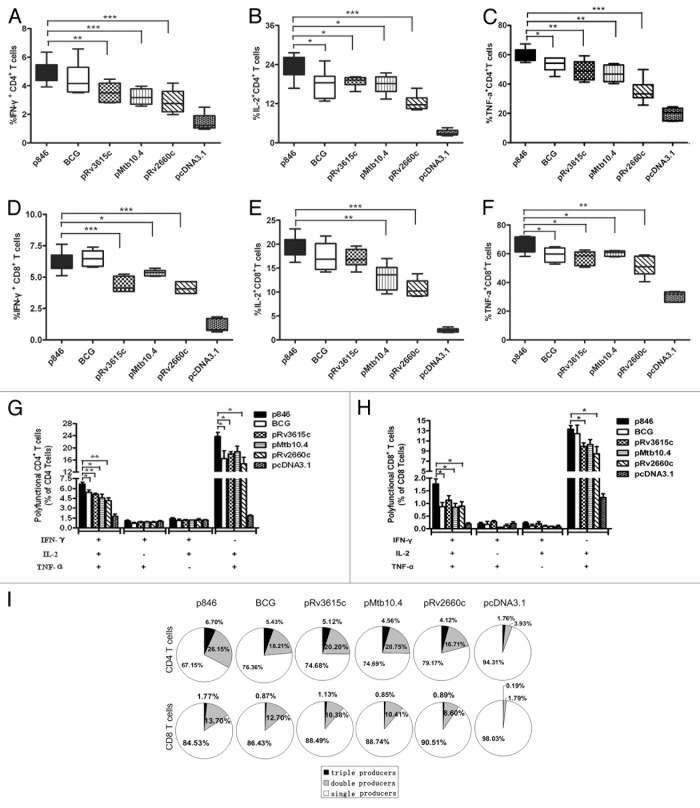
Figure 6. Frequencies of IFN-γ-, TNF-α- and IL-2-producing CD4+ or CD8+ T cells. Mouse splenocytes 2 wk following the last immunization were isolated and stimulated with 10 µg/ml inactivated H37Rv for 24 h. Following extra 4 h re-stimulation, the cells were stained with specific cytokine antibodies and subjected to flow cytometry. Plots were gated on CD4+ and CD8+ lymphocytes and analyzed for (A) Frequency of single positive IFN-γ producing CD4+ T cells, (B) Frequency of single positive IL-2 producing CD4+ T cells, (C) Frequency of single positive TNF-α producing CD4+ T cells, (D) Frequency of single positive IFN-γ producing CD8+ T cells, (E) Frequency of single positive IL-2 producing CD8+ T cells, (F) Frequency of single positive TNF-α producing CD8+ T cells, (G) Frequency of double or triple positive IFN-γ, IL-2 and TNF-α producing CD4+ T cells and (H) Frequency of double or triple positive IFN-γ, IL-2 and TNF-α producing CD4+ T cells. (I) Pie chart analysis total of IFN-γ, IL-2 and TNF-α single producing, double producing and triple producing T cells two weeks after last immunization.

An official website of the United States government
Here's how you know
Official websites use .gov
A
.gov website belongs to an official
government organization in the United States.
Secure .gov websites use HTTPS
A lock (
) or https:// means you've safely
connected to the .gov website. Share sensitive
information only on official, secure websites.
