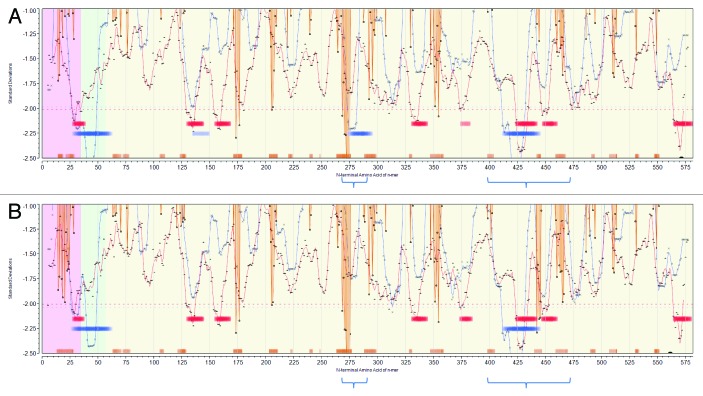
Figure 3. Permuted population profiles of JL5 (A) and Iowa-06 (B). Amino acid positions in HN protein are arrayed N-C on X axis. Red line shows permuted average predicted MHC-IA and IB (37 alleles) binding affinity by index position of sequential 9-mer peptides. Blue line shows permuted average predicted MHC-II DRB allele (16 alleles) binding affinity by index position of sequential 15-mer peptides. Both are plotted in standard deviation units (Y axis). Orange lines show probability of B-cell binding for an amino acid centered in each sequential 9-mer peptide. Note that the standardized B-cell metric has been inverted (multiplied by -1) in order to overlay the standardized probability onto the same scale as the MHC data. Hence, low numbers (valleys) represent predicted high binding affinity of MHC and high BEPI contact probability. Bars (Red:MHC-I, Blue:MHC-II) indicate the top 10% affinity binding. Orange bars indicate top 25% probability B-cell binding. Background shading shows membrane (green) extramembrane (yellow), intramembrane (pink) location. The downward orange spike at 269–275 correlates with the experimentally determined principal neutralizing antibody epitope. The two regions of high density predicted MHC-II binding are indicated by the blue brackets below.

An official website of the United States government
Here's how you know
Official websites use .gov
A
.gov website belongs to an official
government organization in the United States.
Secure .gov websites use HTTPS
A lock (
) or https:// means you've safely
connected to the .gov website. Share sensitive
information only on official, secure websites.
