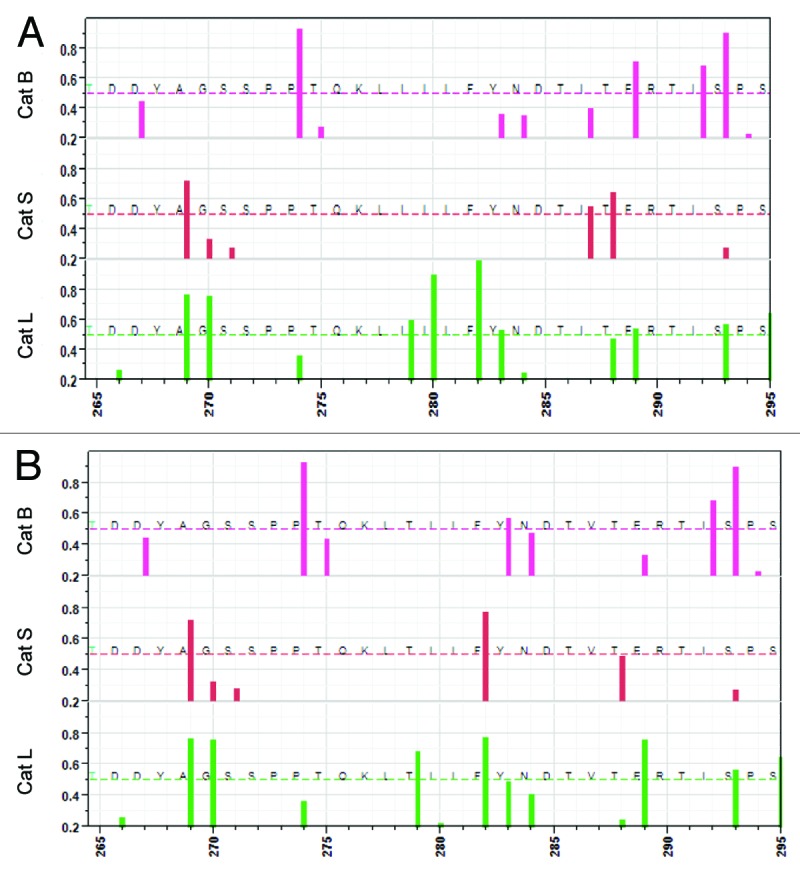
Figure 4. Predicted cleavage sites for cathepsin B, cathepsin S and cathepsin L between amino acid positions 265–295. (A) JL-5, B: Iowa-06. X axis shows the amino acid positions from 265–295, one of the regions of high predicted epitope density. Y axis shows the predicted probability of cleavage by one of three different endosomal cathepsins, top to bottom cathespin (B) (pink), cathepsin S (red) and cathepsin L (green). The bar indicates a cleavage on the C-terminal side of the amino acid at that position. Only probabilities >0.2 are shown. The dotted lines indicate probability of 0.5.
