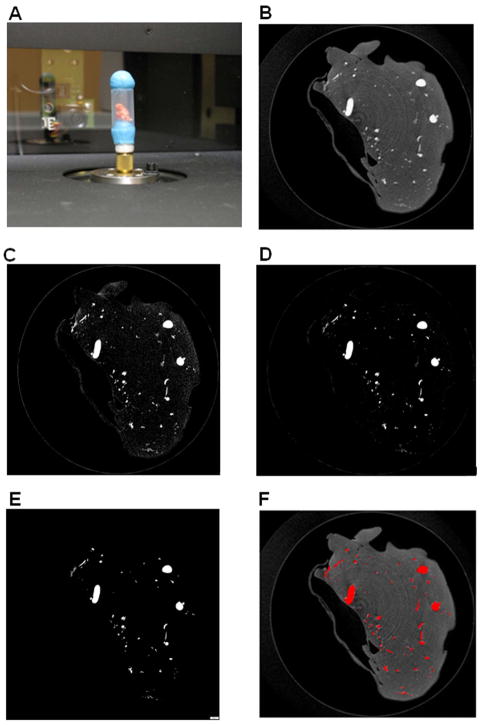
Figure 2. MicroCT scanning set up; raw and thresholded images.
(A) A perfused tumor specimen (with orange-colored Microfil solution) prepared for X-ray scanning. The specimen was held in place in a polyethylene tube with poster putty (blue) on top and bottom, and the assembly was fixed onto a brass spigot in the SkyScan scanner. (B) Example of a raw. BMP reconstructed image slice (3 μm thick) from a scanned LLC tumor sample including the polyethylene tube, before reconstruction. Small and large vessels are seen in cross-section as bright grey regions, within the darker grey surrounding tissue, which weakly absorbed the X-rays. The tube, which weakly absorbs X-rays, can usually be seen around the periphery (*). (C) The same cross section from (B) after the first thresholding step (lower limit 75, upper limit 225) using the CTAn Task list. (D) Image from (C) after despeckling. (E) The final cross section converted to a binarised image after a second threshold step (lower limit 105, upper limit 225). This series of steps preserves small diameter vessels, seen here as small white dots, while eliminating background pixels from the surrounding tissue and the tube. (F) Overlay of binarised final image from (E), pseudocolored red, with raw reconstruction scan from (B). Note the absence of background pixels in the final processed image (E), which otherwise can create background voxels in the 3D models that would also be included in the analysis. Bar, 400 μm.

