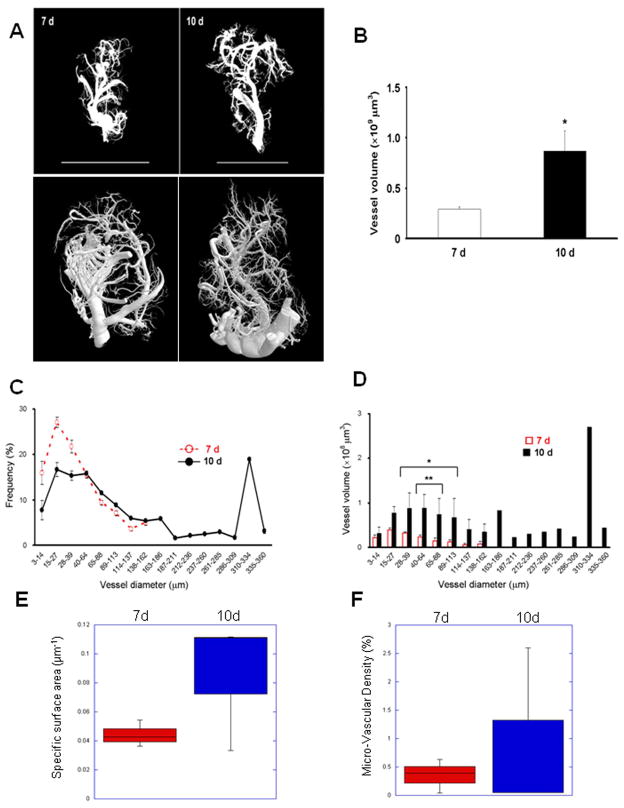
Figure 3. Tumor neovasculature 3D modeling and analysis by X-ray μCT scanning in wild type (WT) C57Bl/6 mice.
(A) Sample images of 3D reconstructions of neovasculature in LLC tumors (left, 7 d; right, 10 d) acquired by X-ray μCT scanning of tumors derived as in Figure 1D at 3 μm voxel resolution, followed by post-scan processing and 3D reconstruction. Top row, reconstruction view in CTVol; bottom row, using CTVox (different samples). Bars, 10 mm. (B) Total vessel volumes in 3D reconstructed vascular models from tumors derived in WT mice. n=3, * p < 0.01. (C) Frequency distribution of the vascular diameters in LLC tumors at 7 d (dotted red line) and 10 d (solid black line). (D) Individual vessel volumes plotted against vascular diameters from (C) (* p < 0.05, ** < 0.01). (E) Vascular specific surface area in 7 d and 10 d tumors determined by the ratio of total vascular surface area to volume. (F) Micro-Vascular Densities in 7 d and 10 d tumors determined as the percentage of total tumor volume occupied by the vascular casts.

