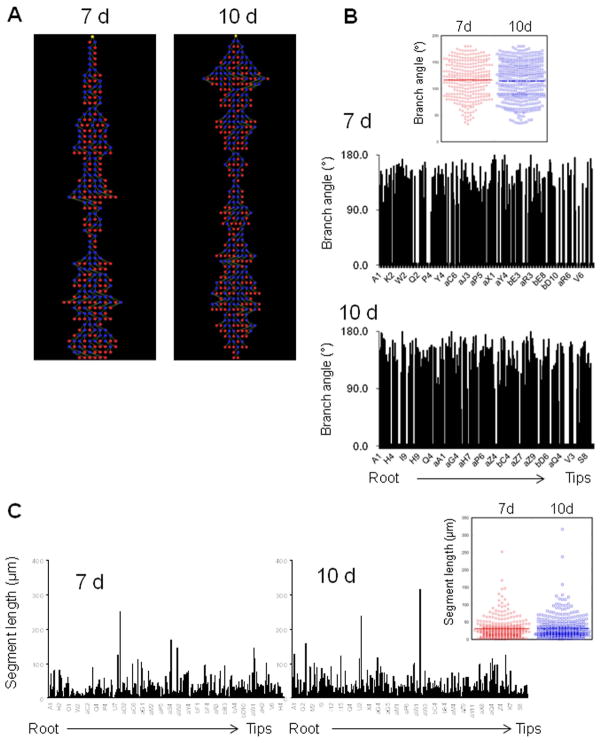
Figure 4. Tree analysis of LLC tumor neovasculature.
(A) Representative tree structures determined from μCT vascular reconstructions in xenografted LLC tumors at 7 d (left) and 10 d (right) post-implantation. Yellow nodes represent the tree root, blue nodes indicate branch or bifurcation points, and red nodes indicate branch termini. (B) Branch angle measurements are shown for each tree segment from (A), beginning with “A1” as the root segment. 7 d, top; 10 d, bottom. Inset, dot plot of branch angles at 7 d and 10 d, excluding angles of 0° from non-branched segments. Medians are shown with a horizontal line in each case. (C) Segment length measurements from the tree analysis. 7 d, left; 10 d, right. Inset, dot plot of all segment lengths at 7 d and 10 d. Medians are shown with a horizontal line in each case.

