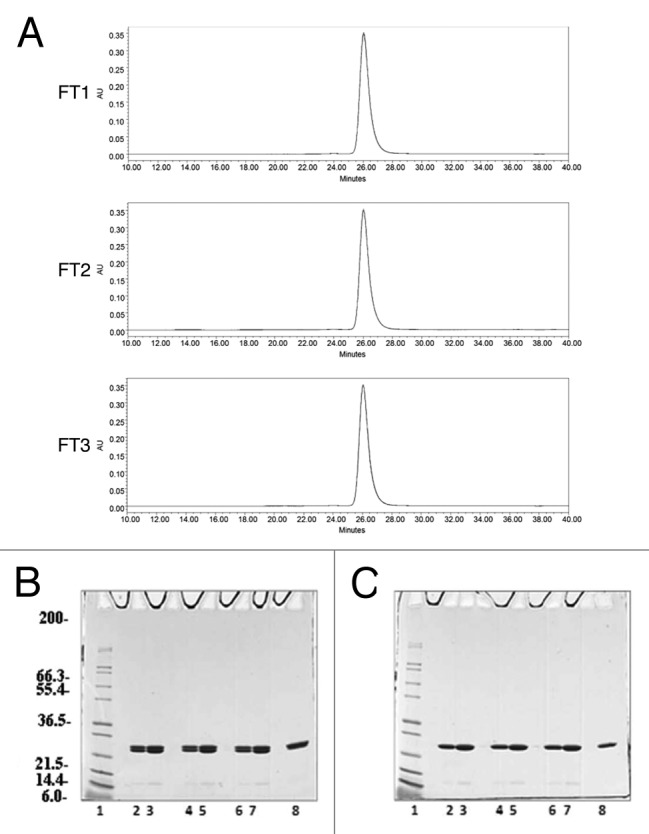
Figure 6. Analysis of the Na-GST-1 purified protein after 3 freeze/thaw cycles. (A) Representative SEC-HPLC elution chromatograms of the Na-GST-1 sample after 1 freeze/thaw cycle (FT1), 2 freeze/thaw cycles (FT2), and 3 freeze/thaw cycles (FT3), respectively. (B and C) Non-reduced and Reduced Coomassie Blue stained 4–20% Tris-Glycine SDS-PAGE gels of Na-GST-1 purified samples after 1, 2, and 3 freeze/thaw cycles, respectively. Lane 1: Mark12™ Unstained Standard; lane 2: 2 µg Na-GST-1 (FT1); lane 3: 4 µg Na-GST-1 (FT1); lane 4: 2 µg Na-GST-1 (FT2); lanes 5: 4 µg Na-GST-1 (FT2); lane 6: 2 µg Na-GST-1 (FT3); lane 7: 4 µg Na-GST-1 (FT3); lane 8: 2 µg Na-GST-1 (time 0).
