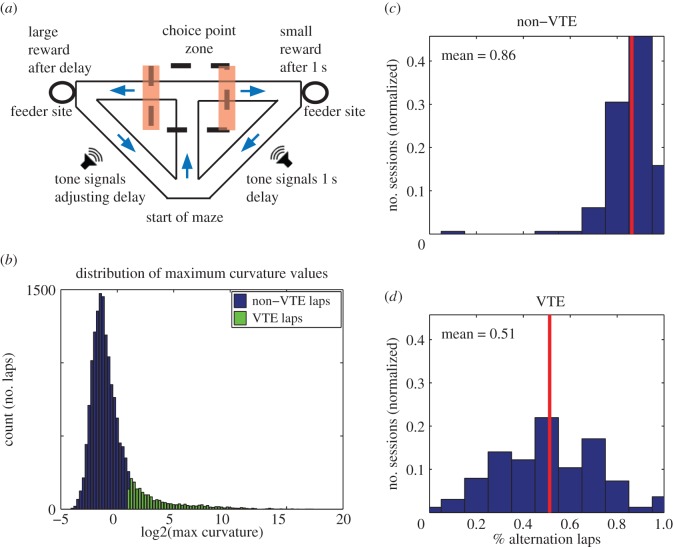
Figure 1.
Task structure of the spatial adjusting delay-discounting maze and definition of VTE events. (a) At the beginning of a session, rats were placed at the start of the maze. Rats ran through the central stem and into the choice point zone (dashed lines). Tones commenced as soon as rats chose one side by exiting the choice point zone (either on the left or the right, orange/shaded bars) and counted down to reward delivery. The assignment of large and small reward sides varied randomly from session to session, but remained constant within a given session. The large reward side delivered a three pellet reward after a variable delay and the small reward side delivered a one pellet reward after 1 s. The session was stopped after the rat had run 100 laps, or after 1 h had passed, whichever came first. (b) Histogram of maximum curvature values from all laps. The degree of pause and look behaviour (VTE) was quantified with a metric called curvature (see Material and methods). High curvature values indicate pause and look behaviour at the choice point. Choice point passes with a maximum curvature >2 were classified as VTE laps. Blue (black in print), non-VTE laps; green (grey in print), VTE laps. (c,d) To determine the relationship between VTE events and alternation/non-alternation laps, we calculated the likelihood that a lap was an alternation or non-alternation lap given that the animal showed VTE or not on that lap. The histograms show the probability that a lap was an alternation lap given that the animal did not show VTE on that lap (non-VTE, c) or that the animal did show VTE (d). Non-VTE laps tended to be alternation laps (mean percentage alternation = 0.86), whereas VTE laps were as likely to be alternation as not (mean percentage alternation = 0.51). (Online version in colour.)

